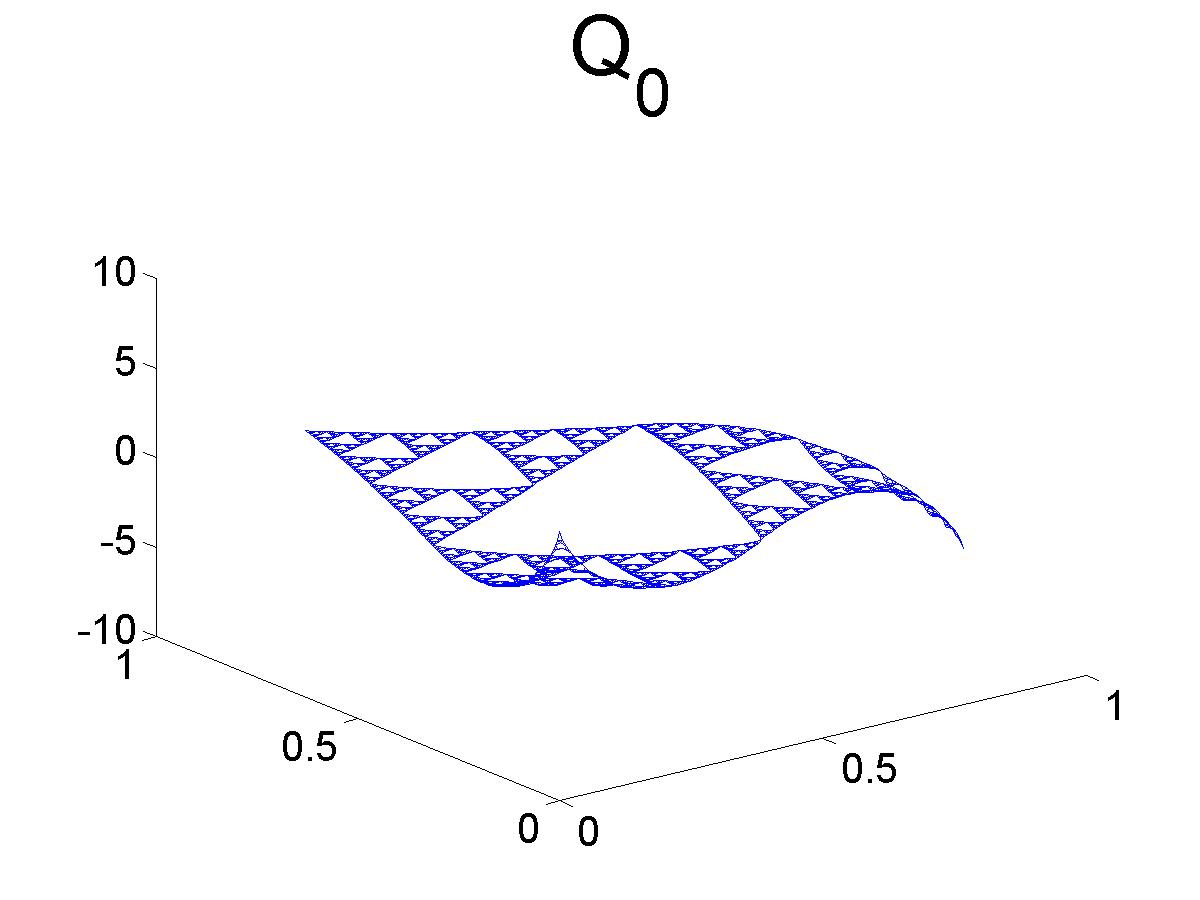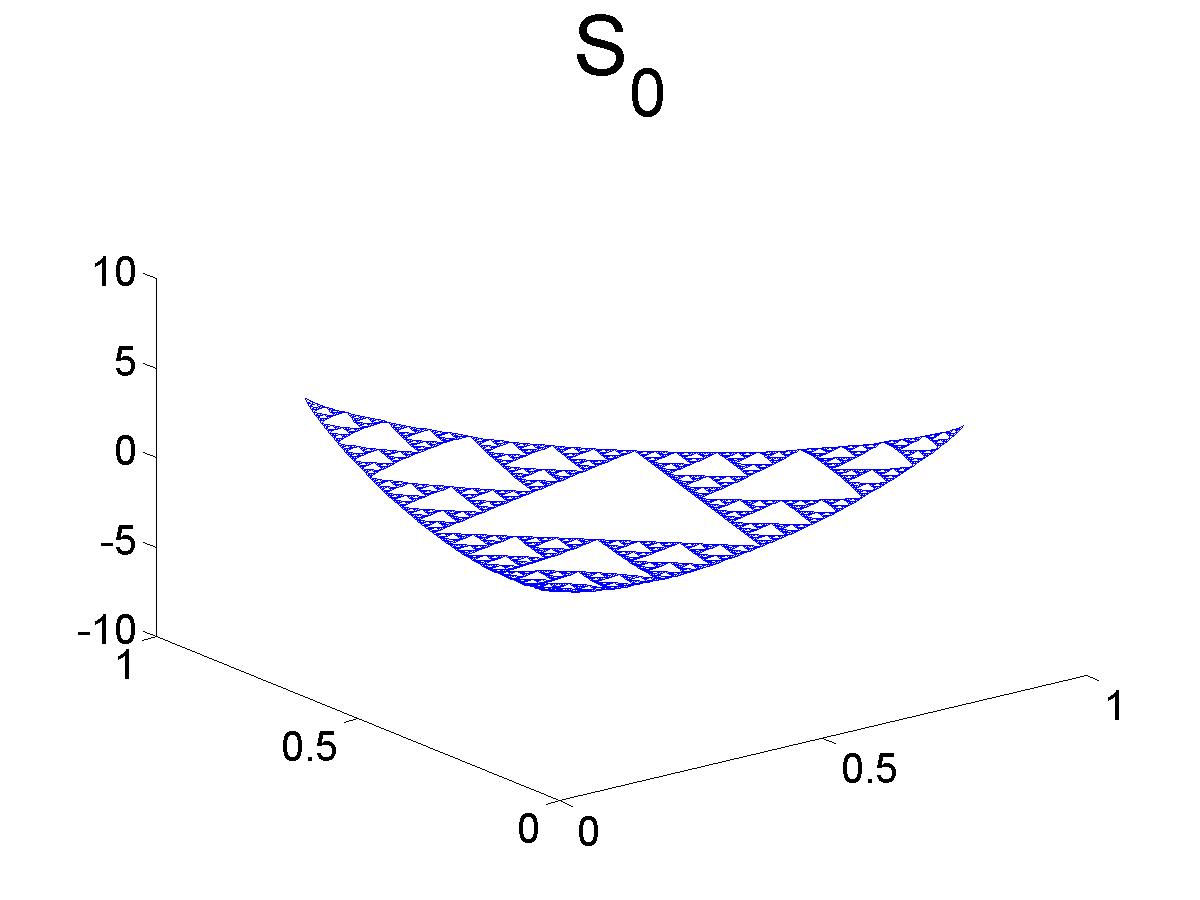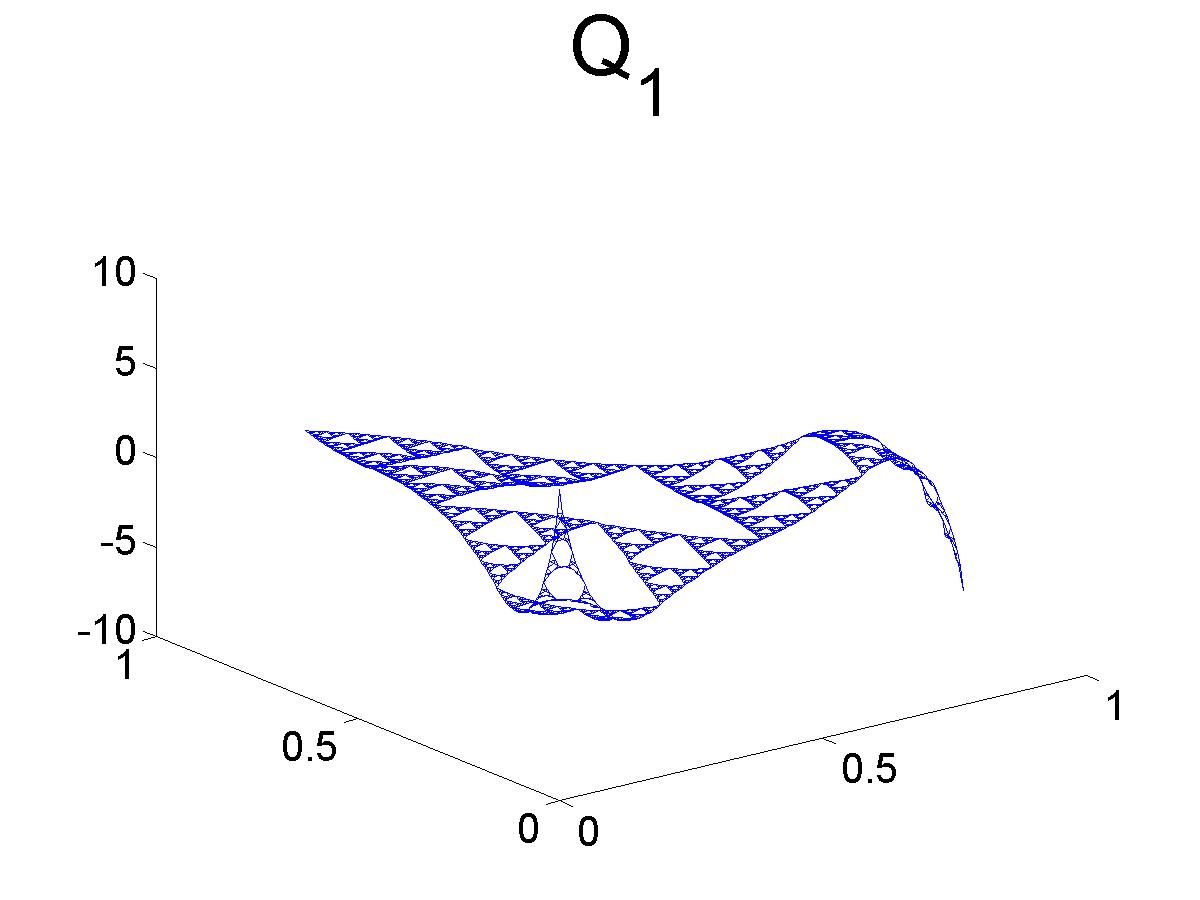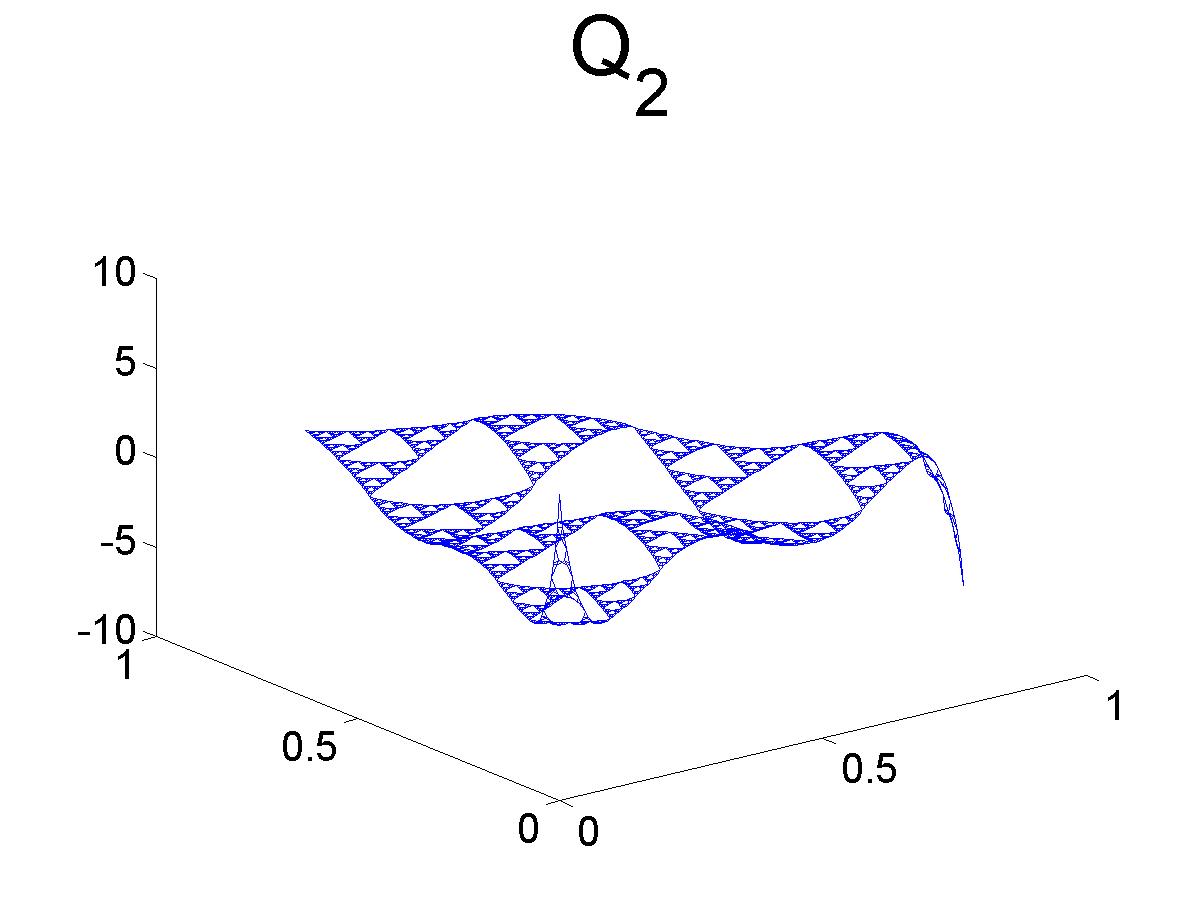
Compare Antisymmetric and Symmetric OP: Graphs
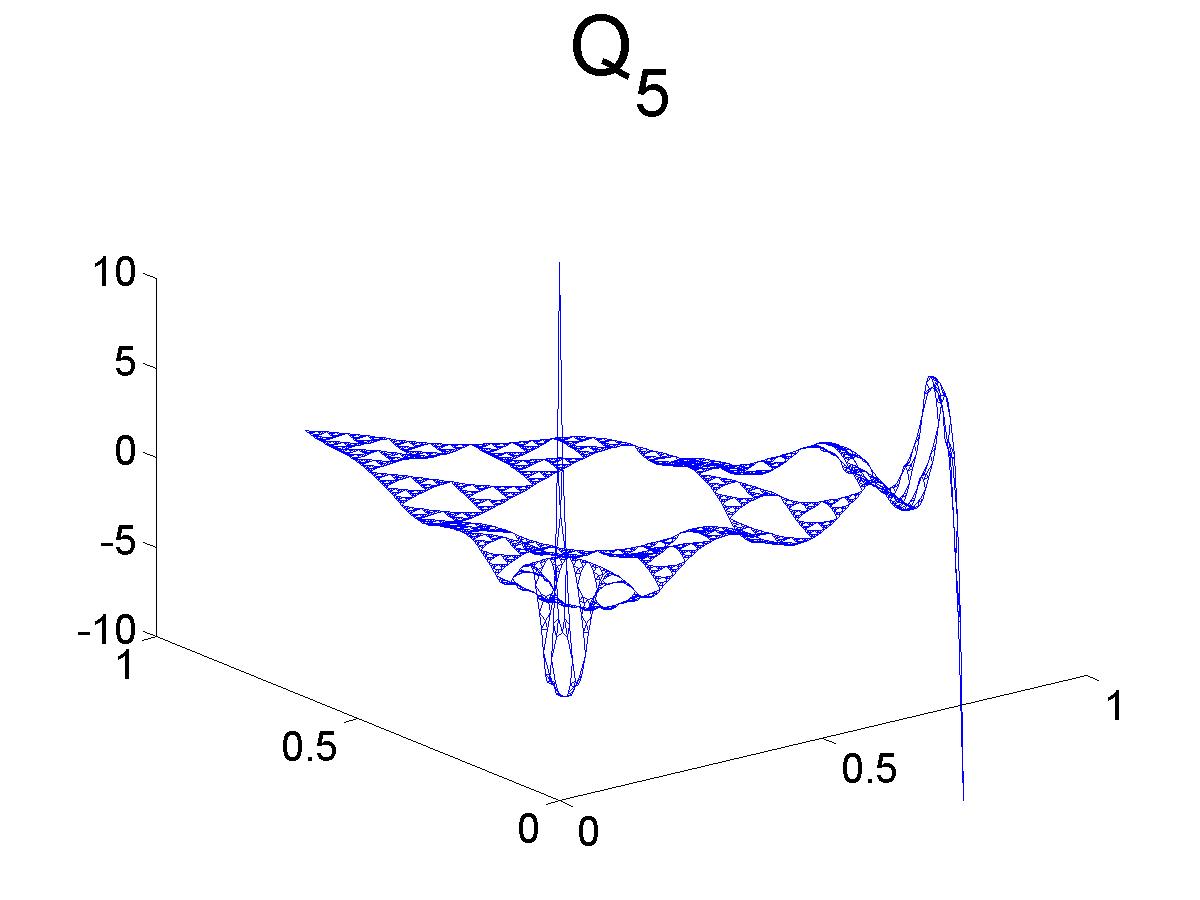
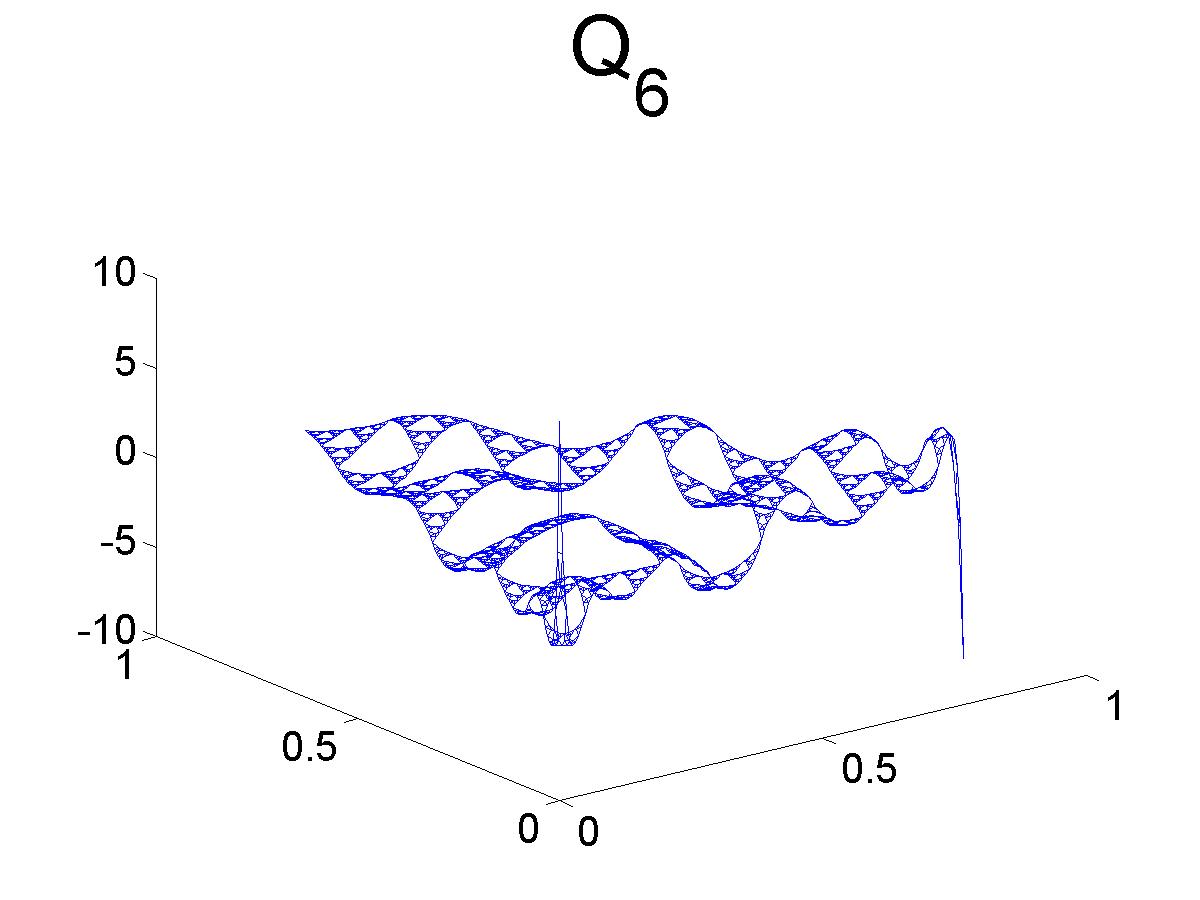
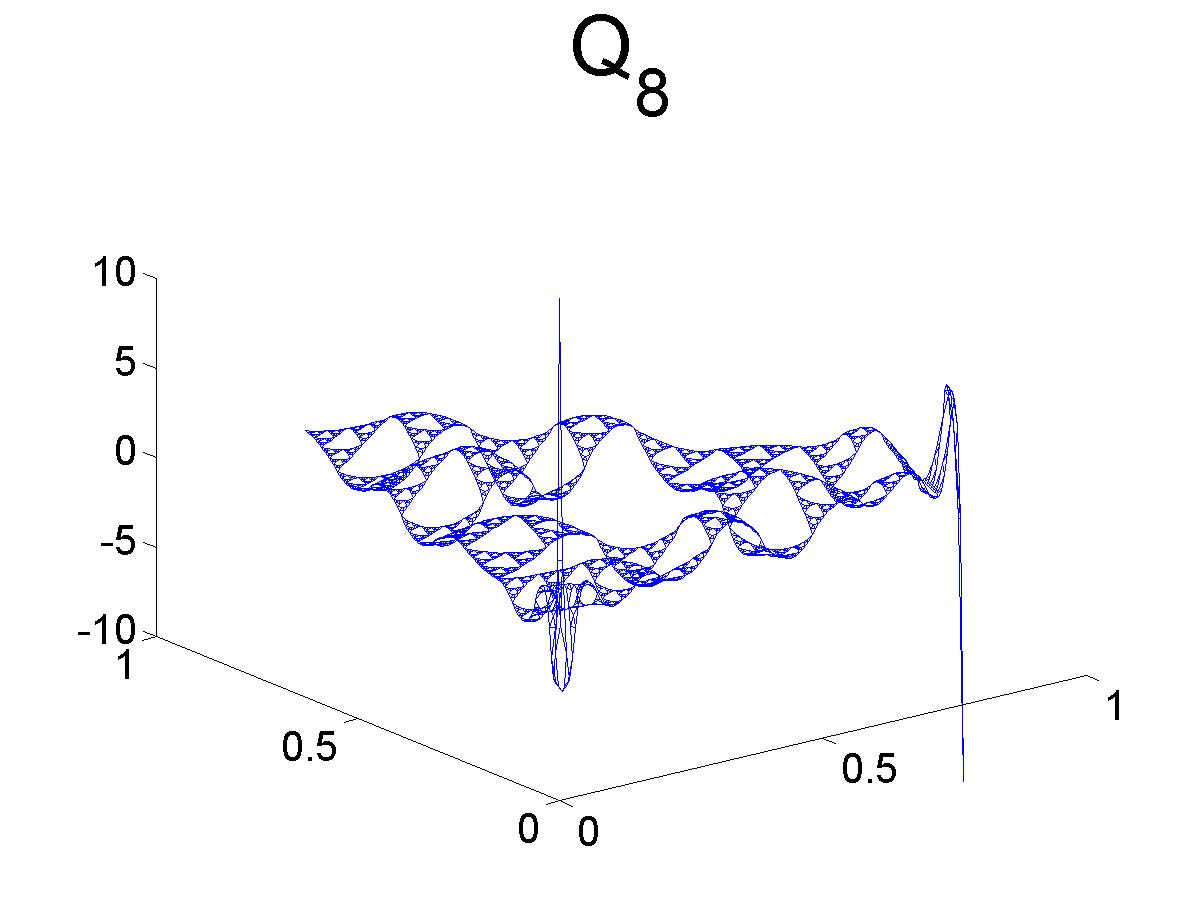
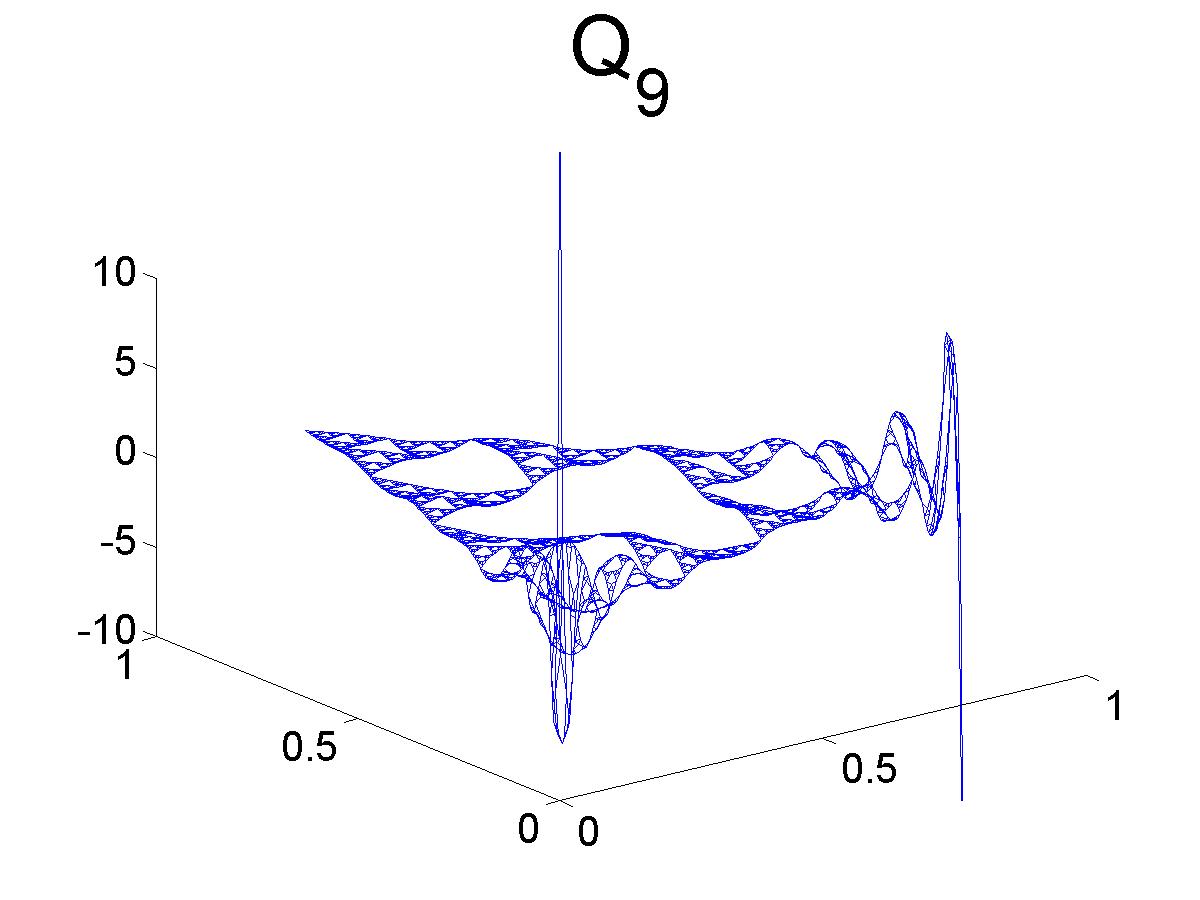
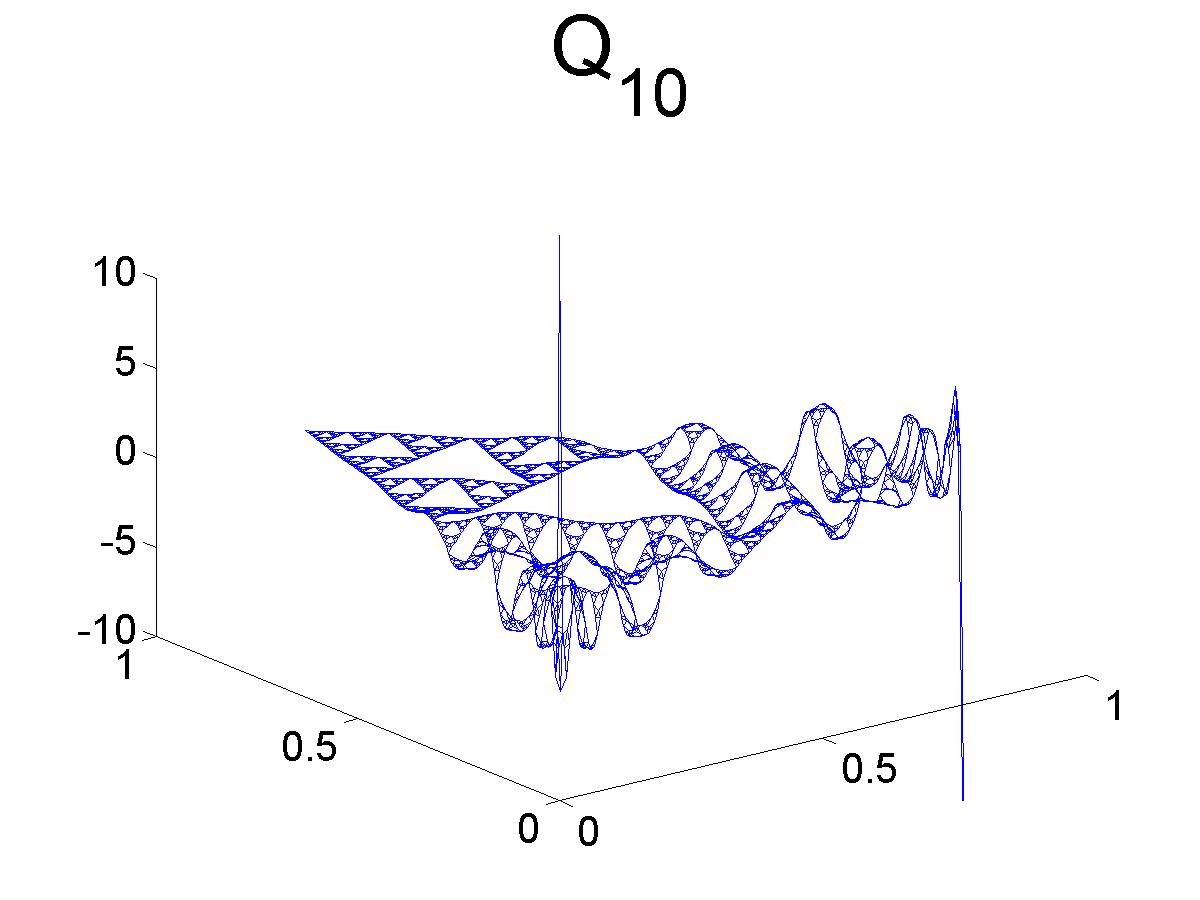
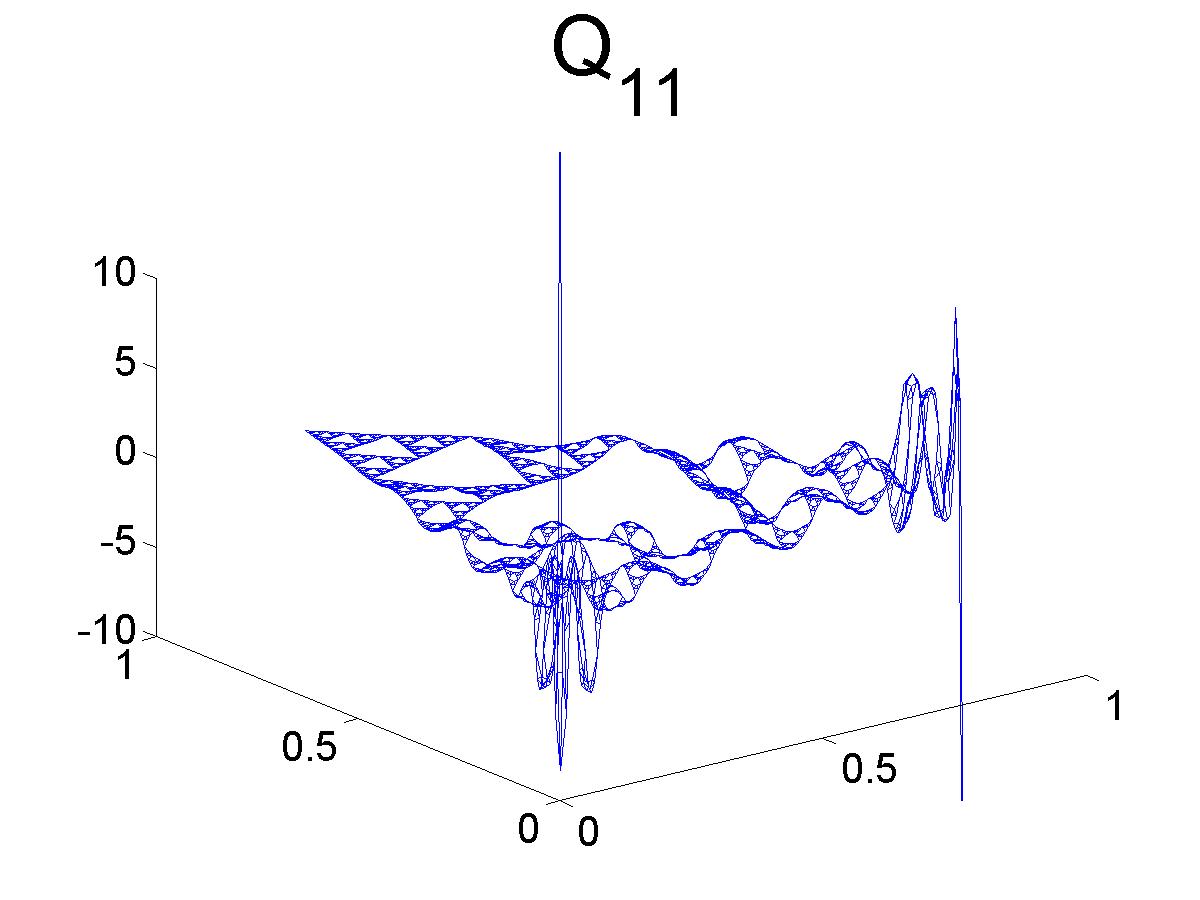
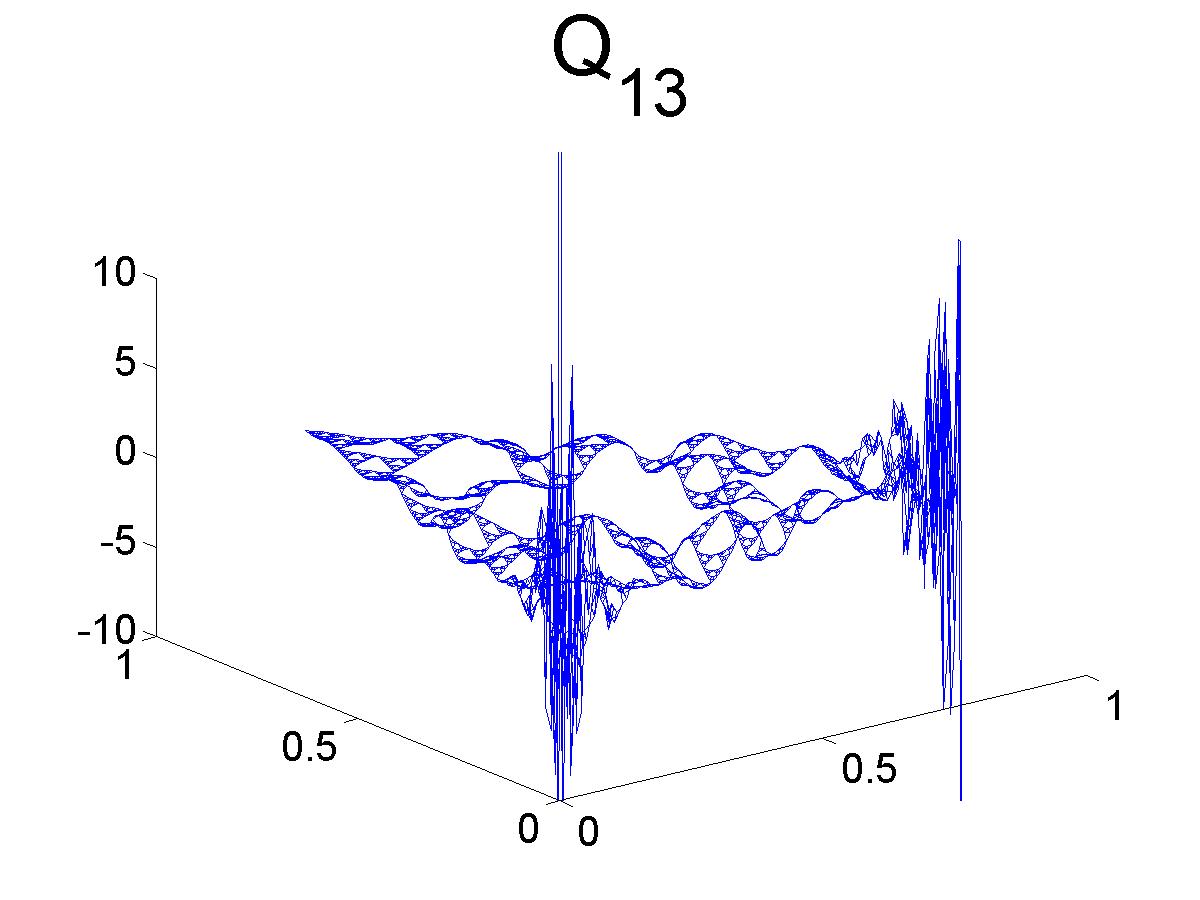
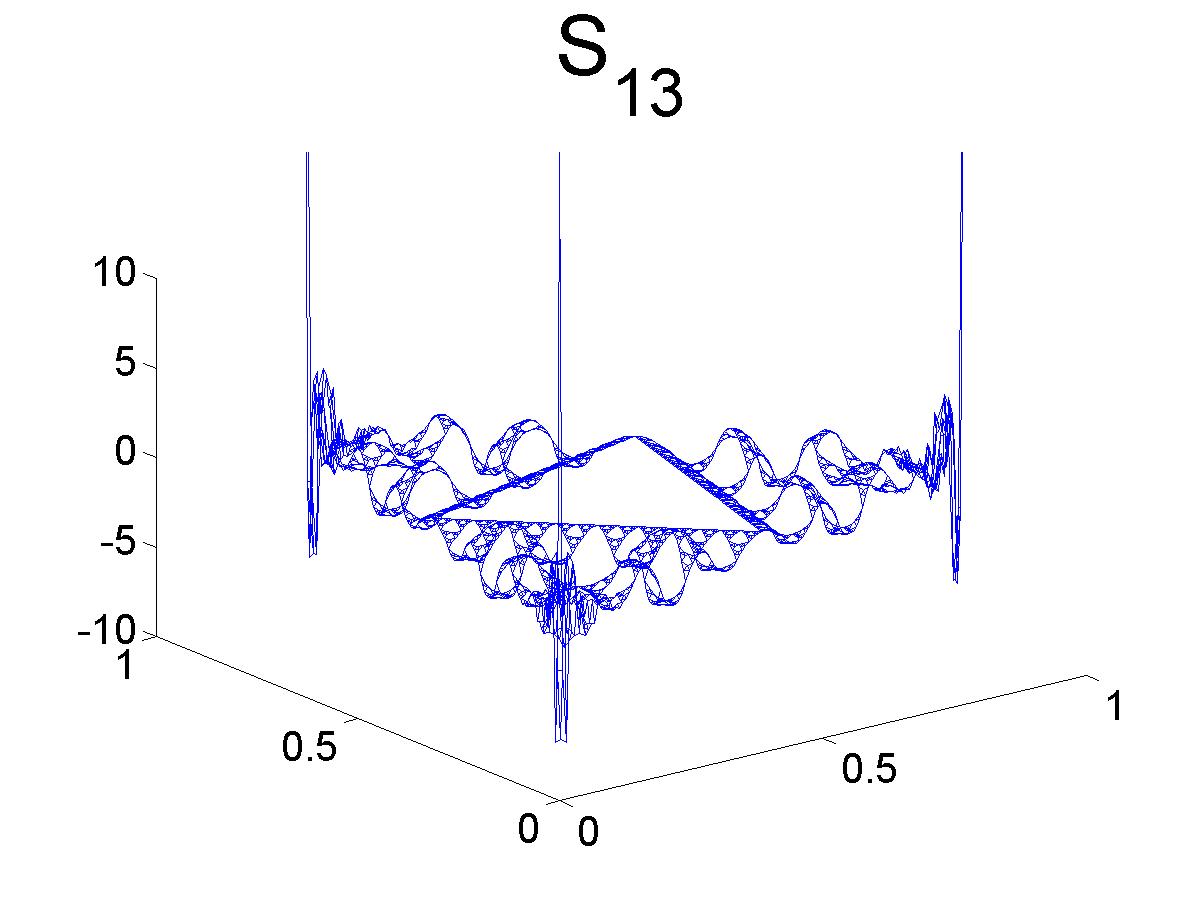
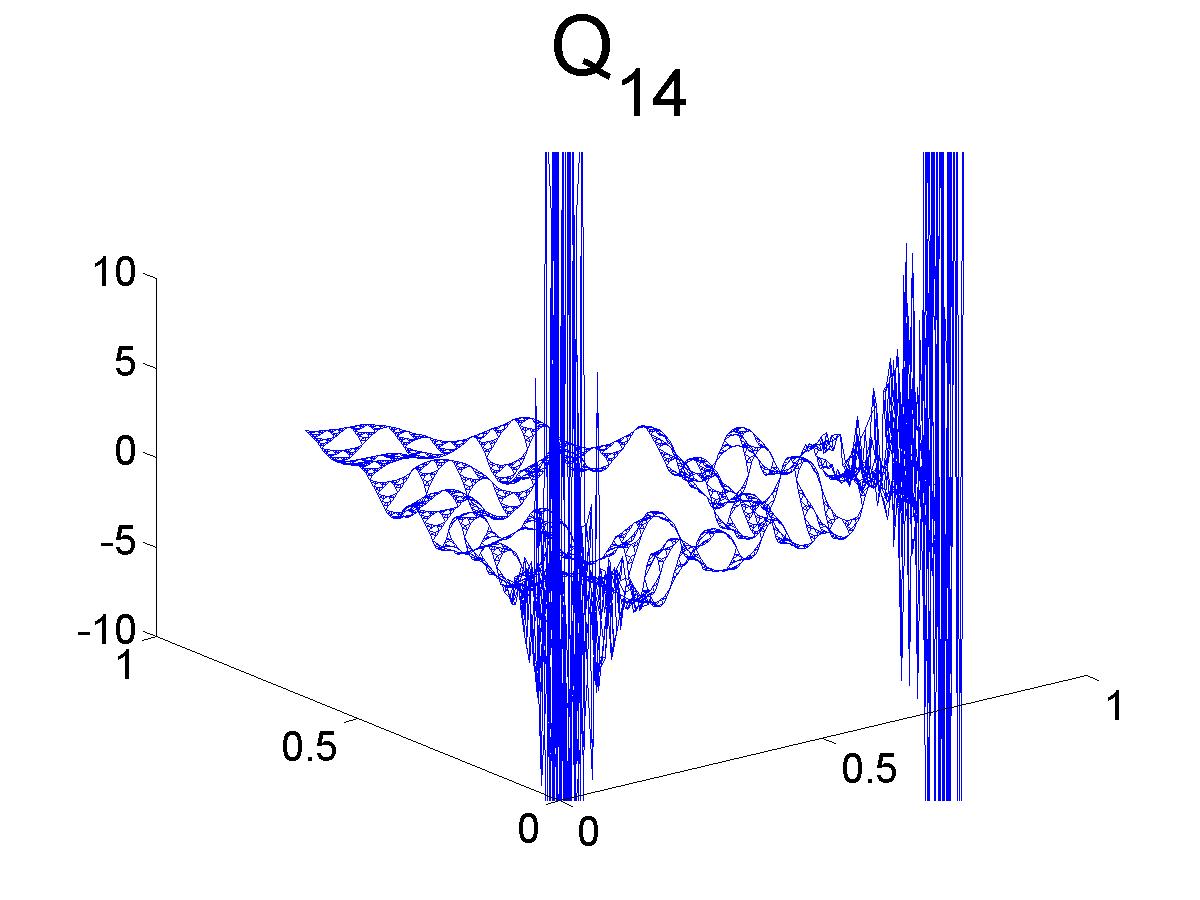
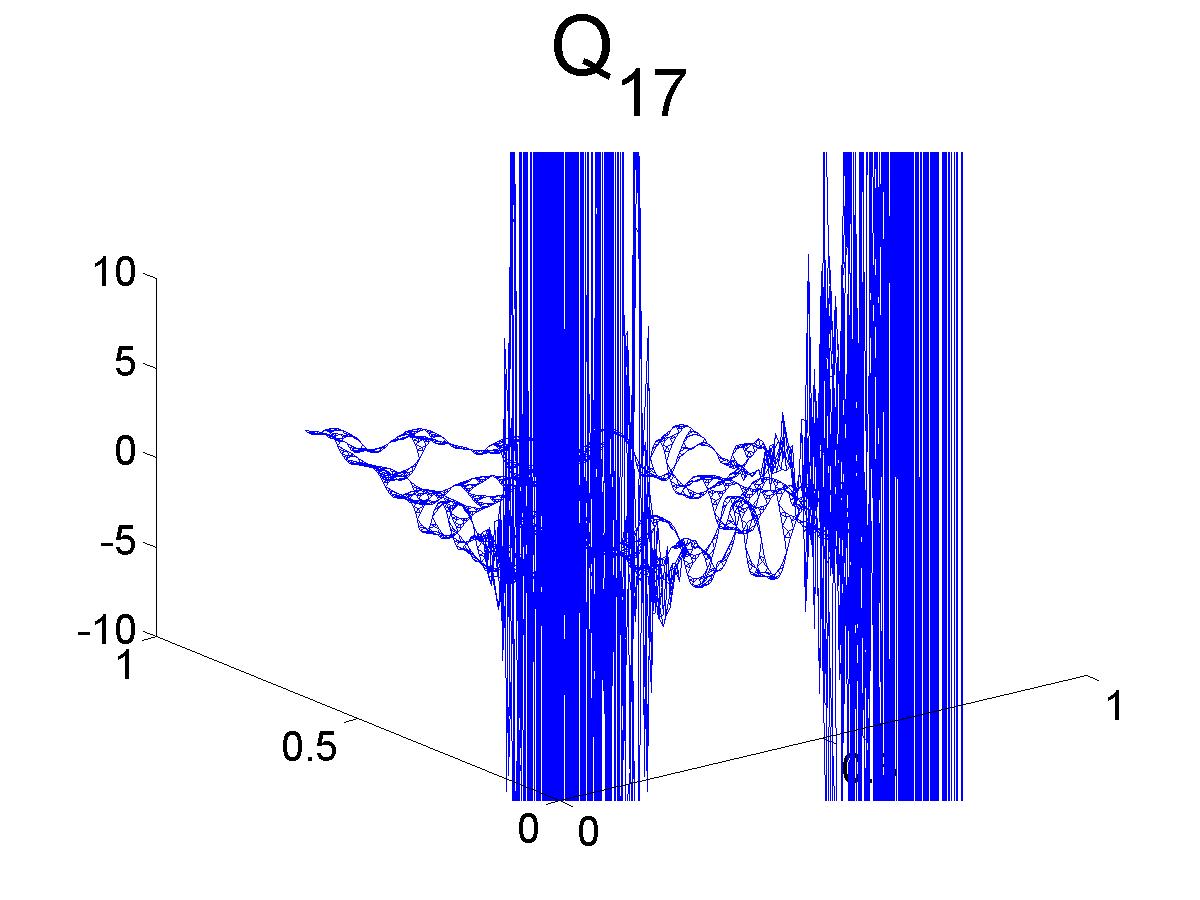
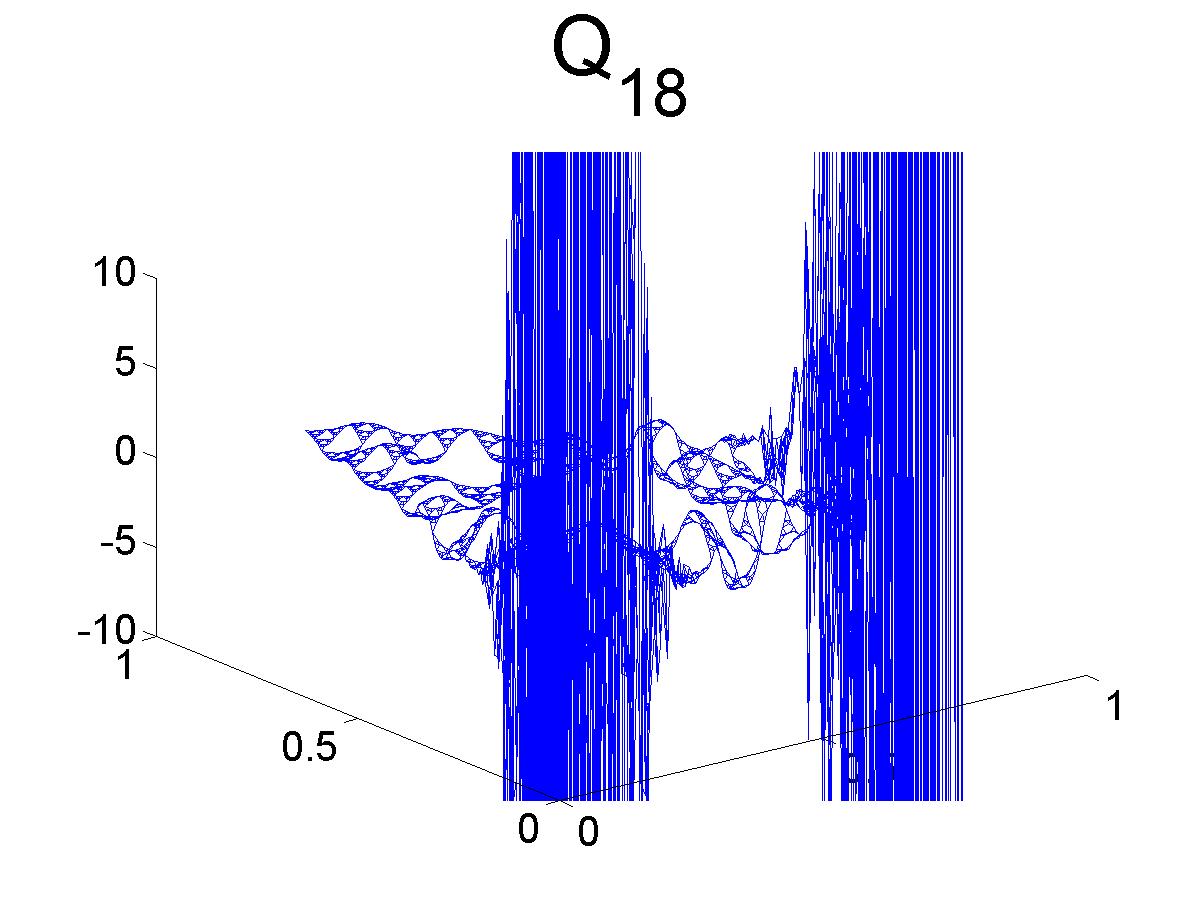
Here we compare the graphs of the Antisymmetric and Symmetric Orthogonal Polynomials. The Antisymmetric OP are shown on the left, and the Symmetric OP on the right. Notice that for both OP, the oscillation tends to concentrate near the eandpoints.
Recall that the graphs of both the Antisymmetric and Symmetric OP display strange behavior near the endpoints for high degree. We believe this behavior may be do to the level of resolution of the graphs (we only calculate the polynomials up to m=7). Note however that this behavior seems to appear later for the Symmetric OP.