|
|
In this episode, the FBI is helping to track down a young man who charms his way into different companies, only to break into their computer system and steal money. He starts with small amounts, then he cleans out the accounts. He also hacks into the personnel records and social security information, before moving on to the next job. The team suspects he might be involved with an Eastern European syndicate, as the inside man. Charlie suggests applying a belief propagation model, also known as a Bayesian network, to try to connect the suspect back to known syndicates. The idea of this modeling is to take all the information you have, and create a graph showing which factors affect which others, and how strongly.
In order to understand belief propagation models, we first need to go over some basic probability. Say we have two coins to toss. Each has an equal probability of landing on either heads or tails. Let event A be “coin 1 lands on heads” and event B be “coin 2 lands on tails.” Then we use the notation P(A)=1/2 and P(B)=1/2. We have the following possible outcomes:
|
|
1 heads |
1 tails |
|
2 heads |
HH |
HT |
|
2 tails |
TH |
TT |
Say we flip coin 2 first. We want to consider the conditional probability of event A occurring, given that event B has occurred, that is we want to know how likely it is that coin 1 lands on heads, knowing that coin 2 has landed on heads. We use the notation P(A|B) to mean "the probability of A, given B". Here of course, coin 1 is independent of coin 2, so P(A|B) =1/2.
Next we will consider the joint probability that two events occur at the same time, denoted P(A,B). Looking at the chart, we can see that there is only one outcome that satisfies both A and B, so P(A,B)=1/4. These two types of probability are related by the following formula:
|
|
Check that this formula holds for the example above.
Note that by symmetry, we also have the formula
|
|
We can solve this for P(A,B) and substitute into the previous formula to get Bayes’ Theorem:
|
|
Let’s do some examples. Say that you are a student, and there is a 20% chance that the teacher will be absent and have a substitute.
In 100 days, how many days would you expect the teacher to be present?
We also know that on the days that the teacher is present, there is a 50% chance of her giving a pop quiz. If she is absent, there is a 75% of a pop quiz. Now, the question we want to answer is, what is the overall probability that there will be a pop quiz today? We want to create a table of information to help us understand all of the probabilities involved.
|
|
Present |
Absent |
Total |
|
Pop Quiz |
|
|
|
|
No Quiz |
|
|
|
|
Total |
|
|
|
The bottom row of the table contains Total Days Present and Total Days Absent. What should these add up to? This number goes in the last box in that row.
The last column of the table contains Total Days with a Pop Quiz and Total Days with No Pop Quiz. What should these add up to? Does this agree with the previous question?
In 100 days of class, how many days is the teacher present? Put this in the Total row of the Present column.
In 100 days of class, how many days is the teacher absent? Put this in the Total row of the Absent column.
For the Present/Pop Quiz box, we need to know how many days the teacher is there and there is a pop quiz. If she is present N days, then N(.50) tells us how many of those days there is also a pop quiz. A similar calculation gives us the boxes Absent/Pop Quiz, Present/No Quiz, and Absent/No Quiz.
Finally, add Present/Pop Quiz and Absent/Pop Quiz to find the Total/Pop Quiz entry. Repeat for the No Quiz row.
Check that Total/Pop Quiz + Total/No Quiz = 100. Does this make sense? Why?
Now let’s check your answers:
|
|
Present |
Absent |
Total |
|
Pop Quiz |
(0.50) (80) = 40 |
(0.75)(20) = 15 |
55 |
|
No Quiz |
(0.50)(80) = 40 |
(0.25)(20) = 5 |
45 |
|
Total |
80 |
20 |
100 |
If this doesn’t match what you got, go back and figure out why.
Let’s write a formula for the answer we wanted:
P(quiz) = P(quiz|present) P(present) +P(quiz|absent)P(absent)
A Bayesian Network is a graphical model that represents variables and their relationships. We use arrows to indicate which variables affect others. Let us expand our previous example to include more factors:
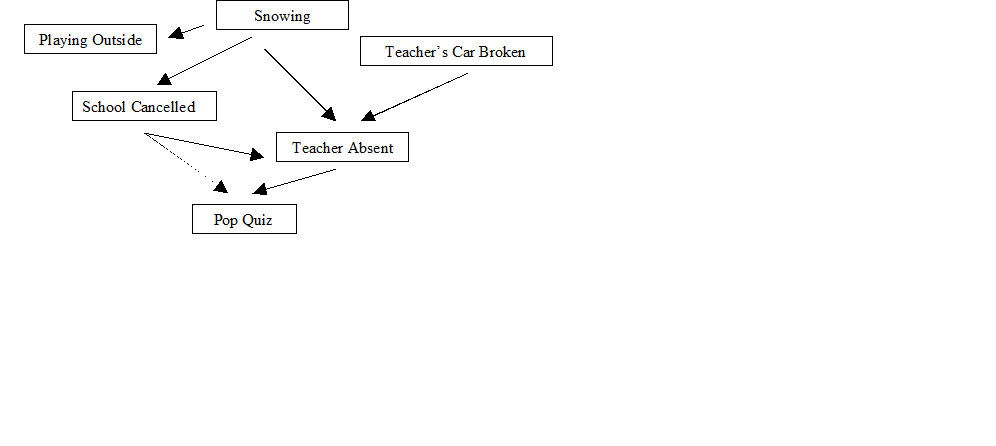
Without calculating anything, we can figure out relationships between variables. For example, whether or not it is snowing affects the chances of there being a pop quiz today, but there is no correlation between the teacher’s car being broken and school being cancelled.
What factors affect Pop Quiz? What factors do not?
What can you say about the relationship between Playing Outside and Teacher Absent?
List other relationships that you can determine from the graph.
Similar (but more involved) calculations to the ones you did earlier give answers to questions like “If there is a pop quiz, then what is the probability that it is snowing?”