17 10 03
I applied a further refinement of Lunter-Miklos-Song-Hein (LMSH)
recursion for the Thorne-Kishino-Felsenstein (TKF) model to
DNA for the zinc finger regions of Mus Musculus proteins
zfp111 and zfp235, and to some mouse and rat cytochromes.
Thanks to Rick Durrett for suggesting these comparisons.
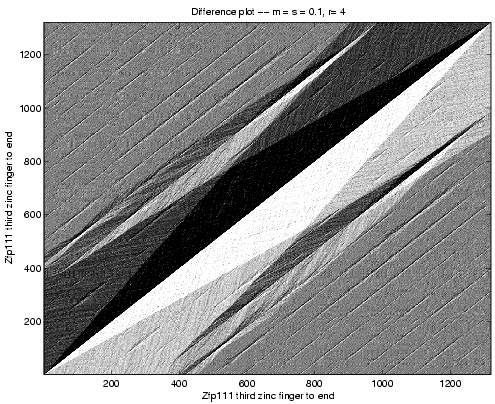
In the implementation which generated to plots below, we fix the insertion and deletion rates to be equal to m, we take the nucleotide distribution from the compared sequences, we denote by s the substitution rate, and by r the odds of a jump event to any point from a terminal state.
We compare the mRNA sequences for proteins Rattus norvegicus cytochrome P450 IIA1 and IIA2, (Cyp2a1 and Cyp2a2), and Mus musculus cytochrome P450, IIA12 (Cyp2a12).
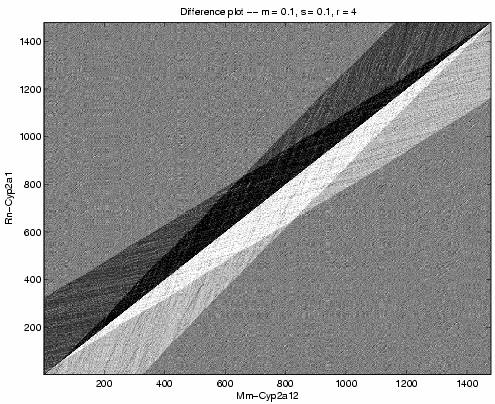
We begin by comparing the three sequences pairwise using the parameters m = s = 0.1 and r = 4.
Above shows a grayscale plot W(i+1,j) - W(i, j+1), where W(i,j) is the log-likelihood of alignment of bases i from the horizontal sequence and j from the vertical sequence. Qualitatively, the other pairwise cytochrome comparisons look the same. The unique sharp diagonal boundary between black and white triangles shows the best alignment -- far surpassing any alternative model.
From this picture, we can infer that the evolutionary history between these sequences contains no jump events. Thus, we set r = infinity for further iterations. We also see no deletion events, so we decrease m.
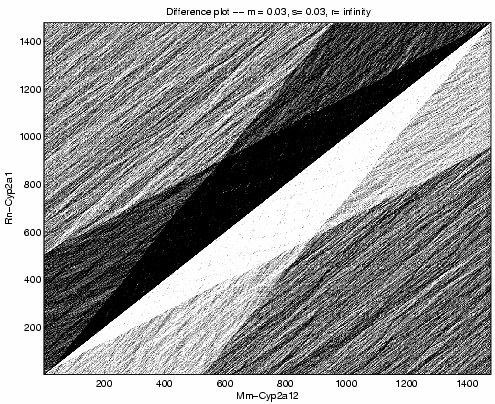
Above shows a grayscale plot of the same procedure with parameters m = s = 0.03, r = infinity. We perform this computation for all three pairs of sequences. For the following pairs, we calculated the difference between the maximum and minimum of the array.
Mm-Cyp2a12 Rn-Cyp2a1 2263
Mm-Cyp2a12 Rn-Cyp2a2 2110
Rn-Cyp2a1 Rn-Cyp2a2 2398
Mm-Cyp2a12 Mm-Cyp2a12 2844
We expect two random sequences to be about 27% identical. The value is greater than 25%, because the distribution of nucleotides is not flat. We know Mm-Cyp2a12 is 100% identical to itself. Therefore, a difference of 38 units of log-likelihood represents 1% of sequence identity for these sequences and parameters.
We estimate the following sequence divergences:
Mm-Cyp2a12 Rn-Cyp2a1 14.9%
Mm-Cyp2a12 Rn-Cyp2a2 18.8%
Rn-Cyp2a1 Rn-Cyp2a2 11.4%
We compute arrays with new parameters. We maintain r = infinity. We set m = 10-6. We set s to be the whole number percentages near the values computed above. The values of s which produce the maximum log-likelihoods are:
Mm-Cyp2a12 Rn-Cyp2a1 14%
Mm-Cyp2a12 Rn-Cyp2a2 17%
Rn-Cyp2a1 Rn-Cyp2a2 11%
We compare two zinc finger proteins from Mus musculus. We use the mRNA sequences for Zfp111 and Zfp235.
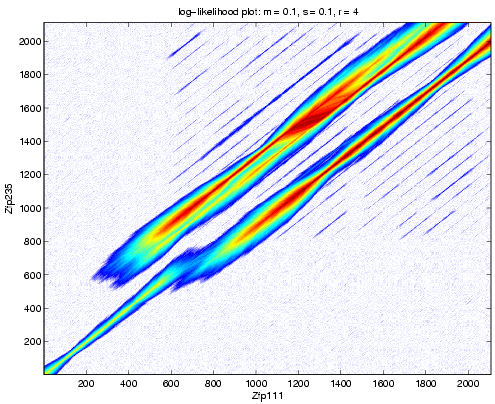
Above shows the likelihood aray computed with these sequences.
We see high sequence identity for the first 537 bases of Zfp111 and 540 bases of Zfp235. This is followed by a mismatch and a net insertion of 222 bases in Zfp235. Beyond this point, we see many parallel tracks, with two more intense than the rest.
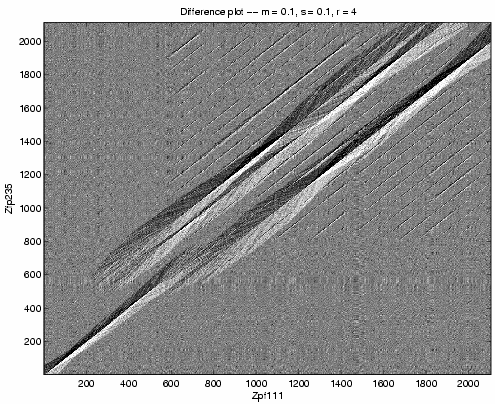
Above, the difference plot shows, with much higher
contrast, there is high sequence identity
between bases 547 through 621 of Zfp111 and 722 through
843 of Zfp235. Past these coordinates, the parallel
tracks suggest near-repeat subsequences and the black
and white diamonds indicate the more similar regions.
The diamonds which cover the same vertical coordinates
suggest sequence duplication.
We see insertion of the second Zfp235 zinc finger relative to Zfp111. We see insertion of either the eighth or ninth Zfp111 zinc finger relative to Zfp235.
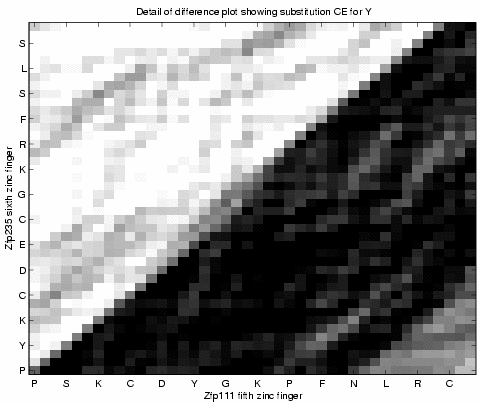
Above shows a detail where there is a
single amino acid deletion from either the sixth or
seventh position of the fifth zinc finger in Zfp111.
Zinc fingers 10 through 13 of Zfp235 match zinc
fingers 10 through 13 and also zinc fingers 14 through 17
of Zfp111. Above comparison of Zfp111
against itself confirms the duplication by the small
black and white diamonds off the large one, in the
upper right.