
In this episode, the FBI is searching for a group of girls from China that was brought into the country illegally. The girls might be infected with bird flu, which could cause a pandemic of great proportions.
Many mathematical concepts are used in this episode. We are going to focus on how to model disease dynamics, Ceasar ciphers, and probability matrices.
Mathematicians have modeled the spread of diseases and other epidemiologic phenomena. Usually compartmental models are used to describe an epidemic. These consist of separating a population into disjoint classes, which are represented by compartments. There are also arrows between the classes indicating the movement of people from one class to another.
SIR is a very common compartmental model. It consists of three classes: S (stands for susceptible), I (stands for infectious), and R (stands for recovered). A susceptible person is someone who is not infected, an infectious person is someone who is infected and is able to infect other people, and a recovered person is no longer infectious. The picture below describes the SIR model. We assume that people are born susceptible to a disease (say the flu), and some become infectious and then recover.
In most epidemics, people acquire diseases due to direct contact with infectious people. Here is a link to a Java Applet that models the spread of a disease ¶.
For the Herpes Simplex Virus type 1 (HSV-1 or oral herpes), infections occur as follows: A person obtains the disease after direct contact with someone who is infectious. Once a person gets HSV-1, the person will always have the disease. An infected person may or may not show symptoms, but will have recurrent periods of being infectious (able to infect someone else) until death. Write a compartmental model that describes an HSV-1 infection in a population.
When Charlie and Larry were trying to figure out the message on the woman's foot, they were able to convert the I Ching characters into digits. Then they tried to understand the meaning of the digits using Caesar Shift, a very simple cryptosystem.
For convenience, one usually uses numbers from 0 to N-1 to represent an alphabet of N characters. Suppose we are using the regular 26-character alphabet A, B, C, ..., Z. Then we encode the characters using the table below.
| 0 | 1 | 2 | 3 | 4 | 5 | 6 | 7 | 8 | 9 | 10 | 11 | 12 | 13 | 14 | 15 | 16 | 17 | 18 | 19 | 20 | 21 | 22 | 23 | 24 | 25 |
| A | B | C | D | E | F | G | H | I | J | K | L | M | N | O | P | Q | R | S | T | U | V | W | X | Y | Z |
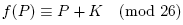
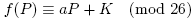
The idea behind the Caesar Shift is a function from the set
{0,1,2,...,25} onto itself given by
| 0 | 1 | 2 | 3 | 4 | 5 | 6 | 7 | 8 | 9 | 10 | 11 | 12 | 13 | 14 | 15 | 16 | 17 | 18 | 19 | 20 | 21 | 22 | 23 | 24 | 25 |
| D | E | F | G | H | I | J | K | L | M | N | O | P | Q | R | S | T | U | V | W | X | Y | Z | A | B | C |
The function f is called the shift, and K is referred to as the key. The comparison of the two tables explains the shift.
 The Caeser shift is named after Julius Caesar (100 BC - 44 BC), who used
the cipher to send coded military messages to his generals.
The Caeser shift is named after Julius Caesar (100 BC - 44 BC), who used
the cipher to send coded military messages to his generals.
At some point during the episode, Charlie and Larry used a probability matrix to find the location of the missing girls. We now discuss what a probability matrix is. Suppose we have a sequence of experiments with possible outcomes a1, a2, ..., an. We further assume that the outcome ai on any given experiment depends only on the outcome of the immediately proceeding experiment (not any of the other experiments). This is called a Markov chain process.
Markov processes are often used to model events in the real world. For example, suppose that an amateur meteorologist notices that the weather on a given day seems to depend on the weather conditions of the previous day. She observes that if it is raining one day, then the next day is sunny 60% of the time and rainy 40% of the time; on the other hand if it is sunny, the next day is sunny with probability 30% and rainy with probability 70%. In this Markov process, there are two outcomes (sunny and rainy). The transition probability between sunny and rainy is 70%, between sunny and sunny is 30%, between rainy and sunny is 60%, and between rainy and rainy is 40%.
More generally, we let pij be the transition probability between
outcomes ai and aj.
These probabilities can be represented compactly in a probability matrix (also known
as a transition matrix or a stochastic matrix) like this:
Markov processes can be drawn as a
transition diagram. In a transition diagram, each outcome (or
state) is drawn as a vertex. Arrows are shown to indicate possible
transitions between states, and the numbers on each arrow indicates
the transition probability. For instance, the simple weather forecasting Markov process that we described above can be represented as:


Activity 5: Obtaining
probability matrix from transition diagram
![]()
Draw the corresponding probability
matrix.
