In this episode, Charlie uses multi-dimensional Venn diagrams to narrow a list of suspects.
A
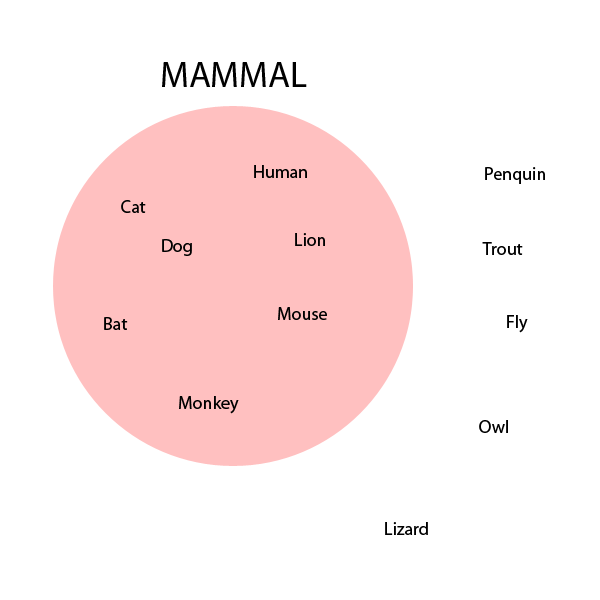
We will develop an example of a Venn Diagram of animals. The simplest type of Venn Diagram shows only one property. Here, we show a Venn Diagram that identifies twelve animals as either being a mammal or not:
Here we separate our list of twelve animals into those that are mammals and those that are not mammals. The names of the seven animals which are mammals are written inside the circle which is labeled "Mammal" and the names of the five animals which are not mammals are written outside of that same circle.
Notice that any property we wish to display using a Venn Diagram must be Boolean. That is, they must always be properties that an object completely has or completely does not have. There can be no somewhat or sometimes having a property if we wish to use Venn Diagrams. One cannot use temperature or weight or length as a property in a Venn Diagram because these quantities are scalar and not Boolean. However, one could use derivative properties such as "weight greater than 10 lbs" as a Boolean property in a Venn Diagram. Presently, all animals are either mammal or they are not, so the property of being mammal is Boolean.
Also notice that the order of items in each region doesn't matter. The animals' names are randomly placed within each of the two regions.
Let us expound upon our previous example by adding another property. The property we will add is "Can Fly".
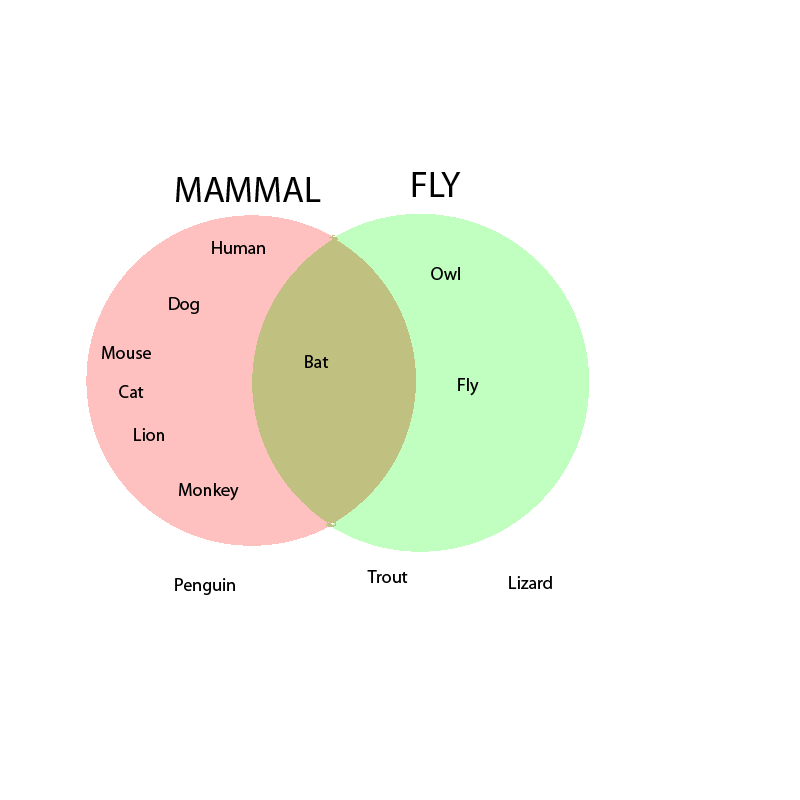
Here the animals that are mammals are contained within the left circle, the animals that can fly are contained within the right circle. The mammals that can fly are contained within the lens created by the two circles. The mammals that cannot fly are contained within the lune on the left and the flying animals which are not mammals are contained within the lune on the right.
If we want to get really crazy, we can add a third property: ability to swim. Here is a Venn Diagram with three properties.
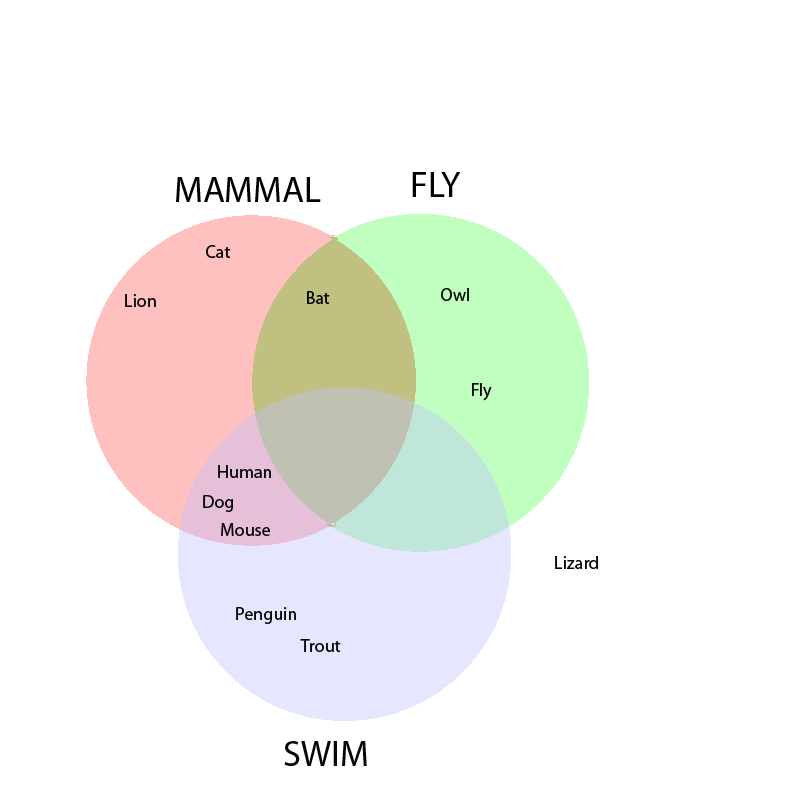
Three is the largest number of properties that a Venn Diagram can represent in a plane, but only if you restrict the the regions to be perfect circles. There are two ways to add more properties. One way, the way that Charlie uses, is to increase the number of dimensions. The second is to make the planar regions more complicated. We will explore both.
One can construct a three-dimensional Venn Diagram using four mutually overlapping spheres in a pyramidal structure. Below is an illustration:

It is not pictured here, but in the center of this structure is a region in which all four sphere overlap.
Higher dimensional analogs can be constructed in much the same manner. An n-dimensional pyramid is constructed using (n+1) overlapping spheres. Such structures can be constructed inductively. Multidimensional Venn Diagrams, while mathematically interesting, are difficult to draw and interpret and so are rarely used to disseminate information.
If we allow shapes other than perfect circles for the regions in a Venn Diagram, then we can create planar Venn Diagrams with four or more properties. The following is an example of a four-property Venn Diagram:
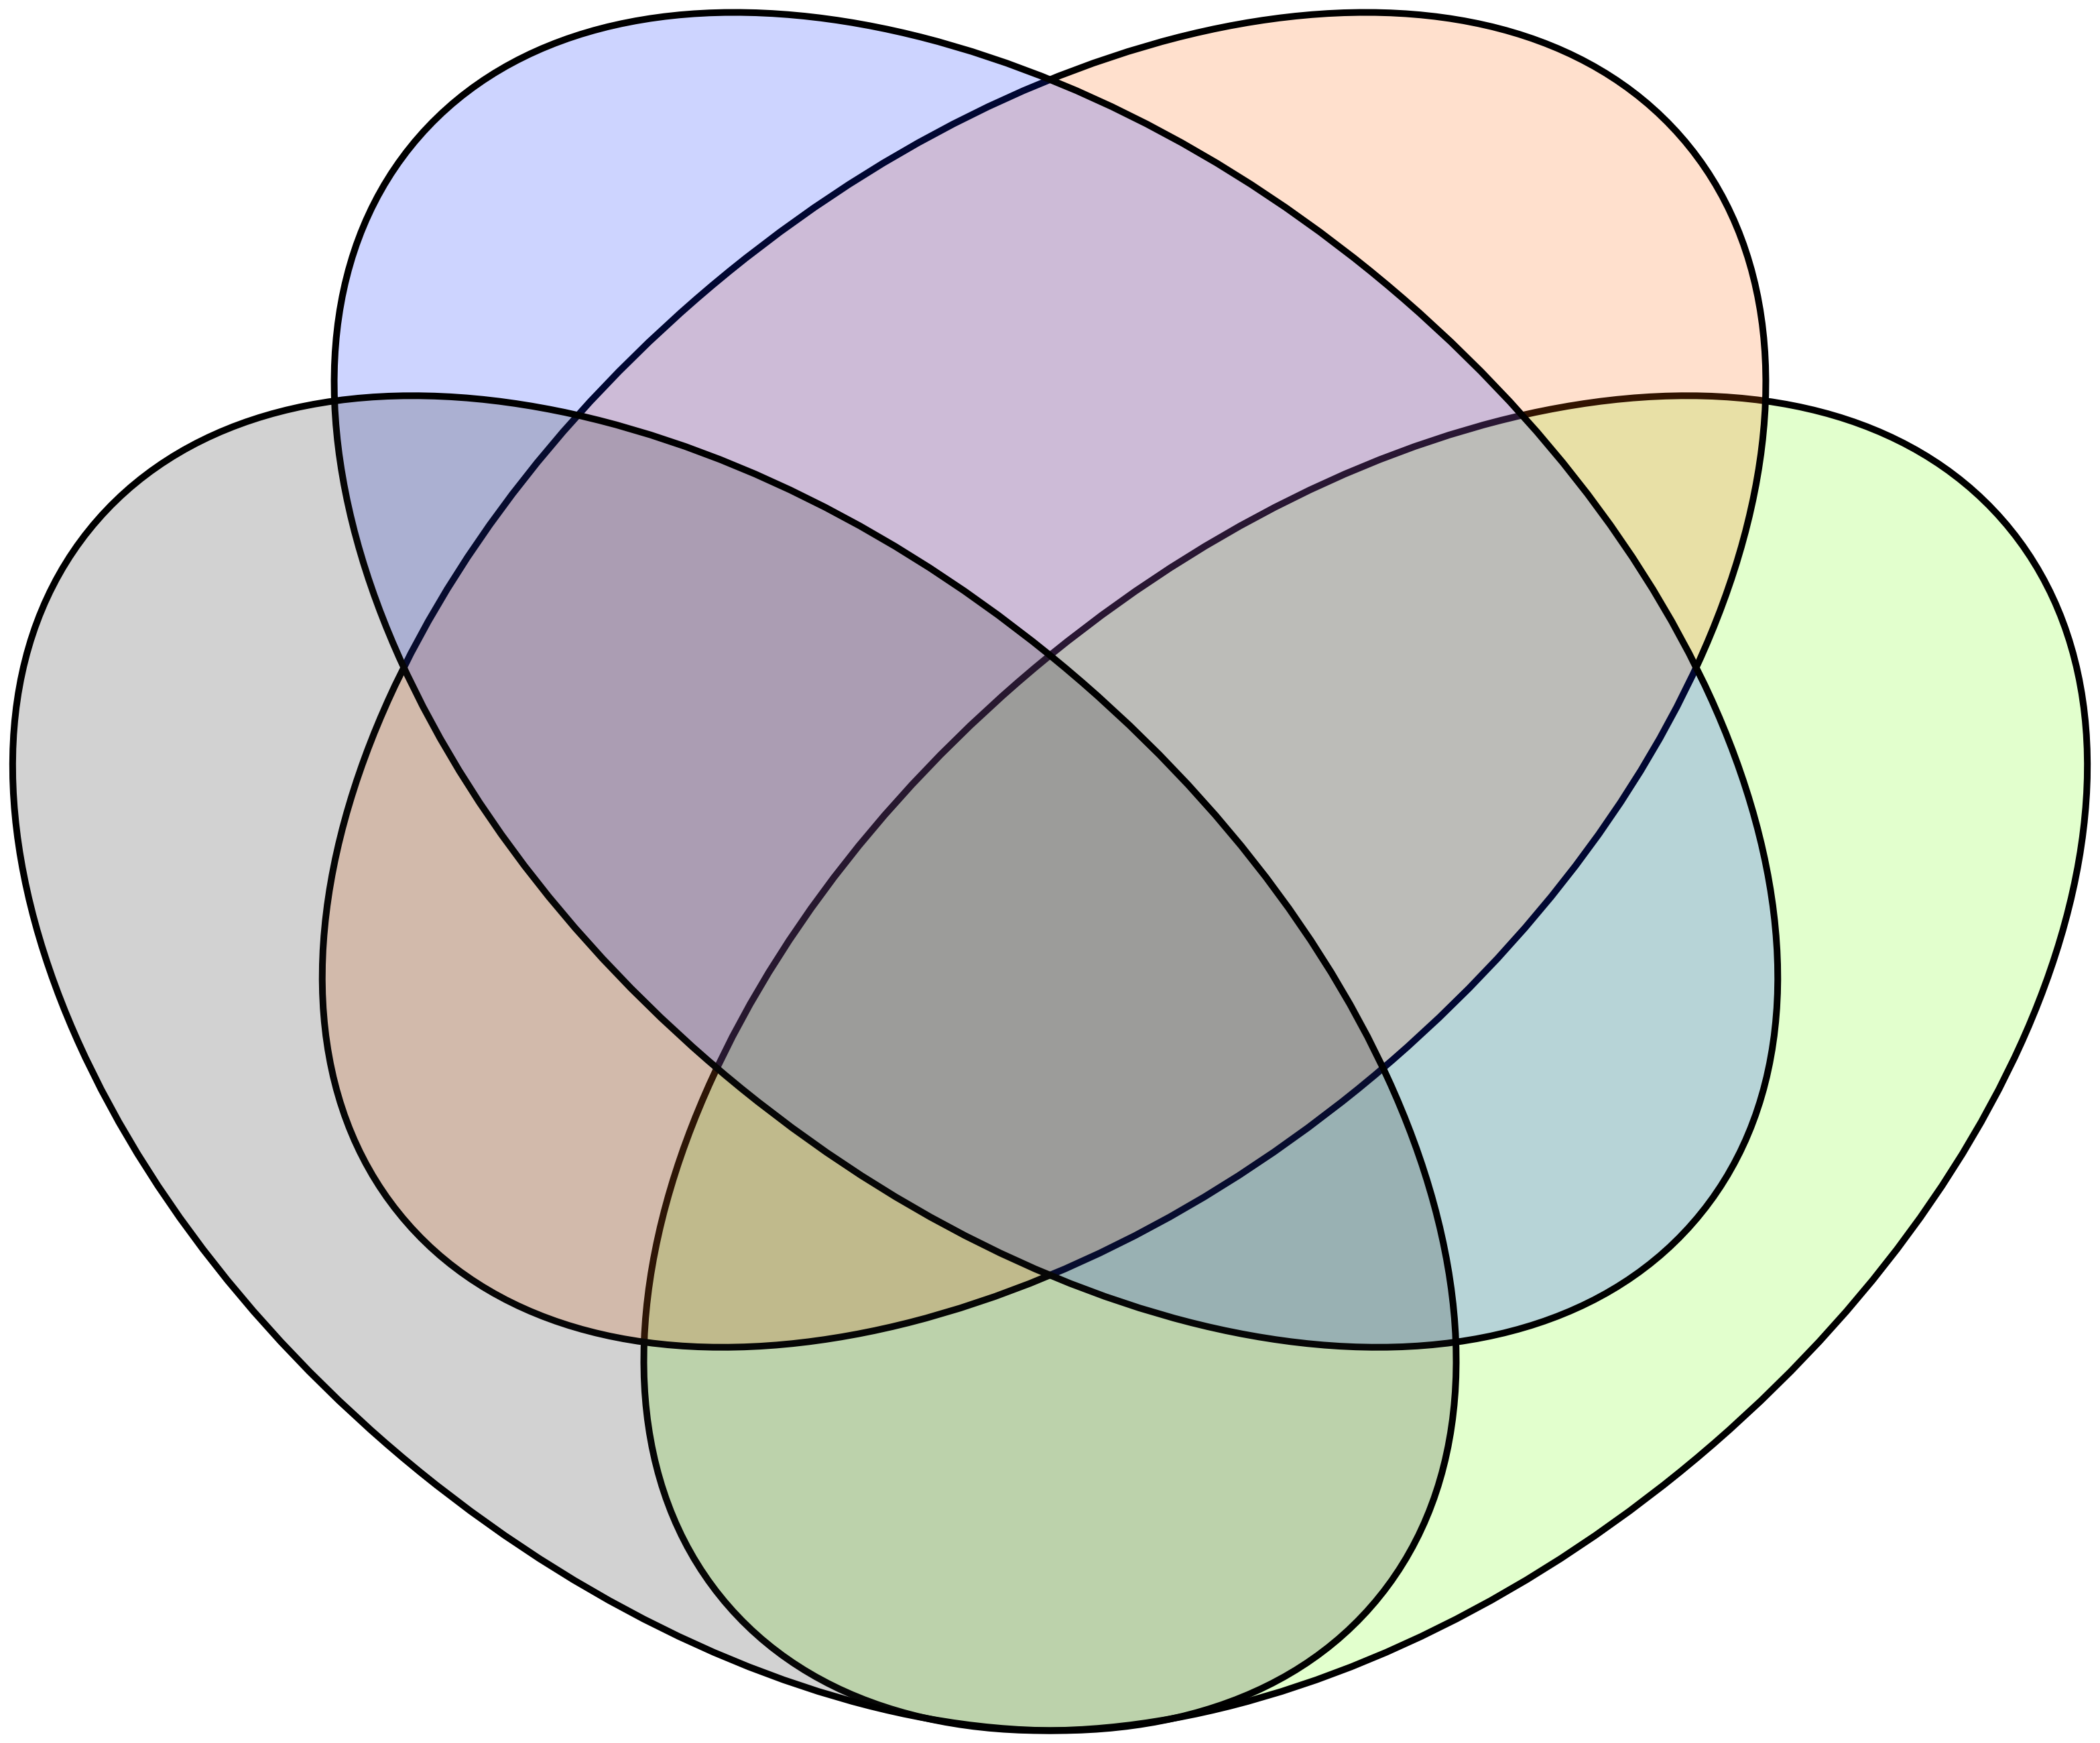
Notice that there are sixteen different regions in the Venn Diagram template above. There is one region for every possible combination of being in or out of four categories.
The following Venn Diagram has five congruent regions, which are each copies of each other, but rotated:

Five is the largest number of regions that a planar Venn Diagram can have with convex regions. Venn Diagrams can be created with any number of regions, though W. D. Henderson proved that symmetric arrangements are possible only when the number of regions is prime. More can be found here.