In this episode Charlie talks about surface tension in water and why it makes drops of water try to be spherical and puddles try to be circles. He also talks about optimization theory and how it applies to matching organ donors with people who need organs.
Now we can use surface tension to explain why puddles try to form circles. (Sometimes circles might not actually be formed because of irregularities in the surface or the way the drop was dropped.) Now imagine a drop of water on a surface. The surface tension will pull the drop together, and this will make the drop try to take on a shape which minimizes the surface area of the drop while maintaining the same volume. If we translate this condition into mathematics, we get the following questions. Given a particular area A in a plane, is there a shape with area A that has a minimal perimeter among all shapes with area A? What is that shape?
The answer to the first question is yes, but to prove it some fairly advanced calculus-type arguments are needed. However, if we assume that such a shape exists, then there is a simple argument that shows the answer to the second question is a circle.
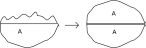
The argument has three steps to it. The first step is to show that the shape S must be convex. This means that given any two points on the boundary, or edge, of the shape, the line segment between these two points lies entirely in the shape. Suppose that S is not convex. Then there are two points P,Q, with the property that the line segment between them doesn't lie entirely inside of the shape S. Then we can move P,Q along the line segment until the line segment L between them lies entirely outside the shape S. Then we can reflect the segment of the boundary of S that lies between P and Q across L to get a new shape with the same perimeter as S but with larger area. This contradicts the assumption that S had the largest area among shapes with its perimeter. This means that S must be convex.
The second step is to show the following statement. If P,Q are points
on the boundary of S that divide the perimeter into two equal parts, then
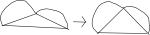
the line segment L between them divides the area into two equal parts. To show
this, we can use another picture. If the area of S below L is bigger than
the area above L, we can remove the half above L and replace it with a
reflected image of the part below L, and this will increase the area of S
while preserving its perimeter. (We know that this move is allowed and that
it increases the area because we know that S is convex.)
For the final step, it is enough to show that if we look at all arcs with
a fixed length and endpoints on a fixed line, the semicircle gives the largest
area. To do this, let P,Q be the points where the arc A intersects the line.
It is enough so show that if we pick any point R on the boundary of A,
the angle PRQ is a right angle. Suppose we pick a point R where this is not
true. Then if you have done the activity above, you know that if we slide
P along the line until the angle at R (the top point of the triangle in the
drawing) is a right angle, we have increased
the area of the triangle. Also, we haven't changed the areas of either
of the regions with a curved border.
The corresponding statement in higher dimensions, that a sphere is the shape with the lowest surface area to volume ratio, is also true, although different methods are required to prove it. This is the reason why balloons are spheres when they are blown up and why rain drops are spheres (or they would be if they were in a vacuum). Some balloons aren't spheres when they're blown up, but that's because some parts of the balloon are thicker than others and resist stretching.
Finding optimal matches between organ donors and organ recipients is a difficult problem that involves a lot of biology and math. However, all the the biology is centered on evaluating how good the matches are. If we assume that if we have one recipient and two donors then we can decide which donor organ is a better match, then we can translate the problem entirely into math. Another simplification we'll make at first is that we have the same number of donors and recipients all at the same time and that there won't be any future donors or recipients.
After we make these assumptions, the problem is mathematically the same as the Stable Marriage Problem. In this problem, we have n men and women and each man has a ranking of the women that he likes, i.e. man 1 likes woman 3 most, then woman 5, then woman 2, etc., and each woman has a similar list of the men. In this case we can (arbitrarily) call the donors the men and the recipients the women. The goal of the problem is to find a stable matching, which means a way of "marrying" the men and women in stable way. This means that there is no pair of a man and a woman who would both prefer to be married to each other instead of to their current spouse. It was proved in 1962 by David Gale and Lloyd Shapley that it is always possible to do this. The algorithm is pretty simple, but before we describe it you can try an exmaple.
| Man 1: | 1 | 2 | 3 |
| Man 2: | 3 | 1 | 2 |
| Man 3: | 1 | 3 | 2 |
| Woman 1: | 3 | 1 | 2 |
| Woman 2: | 2 | 3 | 1 |
| Woman 3: | 2 | 3 | 1 |
The algorithm consists of several rounds of "proposals". At the beginning, each man proposes to the first woman on his list. After this, there is what computer scientists call a "loop", which means that the next two steps are repeated until everyone is married.
You might have the impression that this algorithm seems sexist, since the males are doing all the proposing. If you have that impression, you are very correct. It isn't too hard to show that the results of this algorithm are optimal for the males and worst for the females in the following sense. If there is a stable marriage between a man M and a woman W, we'll call M and W achievable partners. Then the results are optimal for the males in the sense that every male is married to his favorite acheivable partner, and similarly every woman is married to her least favorite achievable partner. Now since we are applying this algorithm to organ donors and recipients, it would probably be a good idea to make the matchings optimal for the recipients.
We have made one large simplification that makes the problem a lot easier to solve. We were assuming that there is just one round of matching organs to recipients. However, in real life there is a constant stream of organs that are being donated and a constant stream of new recipients. This complicates things because there might be a recipient who has an ok match with an organ, but might get a better match in a few weeks. This makes it hard to decide whether or not to take the immediately available one or to wait for a better option. Also, some recipients need organs more urgently than others, and organs only stay fresh for a day or so (to the best of my knowledge). All these factors make assigning organs a very difficult job.