JPG
Numb3rs 316: Contenders

After one of David's childhood friends, Ben Ellis, throws a deadly punch fighting in a mixed martial arts match, he becomes a murder suspect - compounded by a previous virtually identical incident and drugs found in the dead man's system. While things look bleak for Ben, David promises to ask the team to look into the case. They're racing against the clock on two ends - one, fighting to keep Ben out of jail and two, trying to find out who the real killer is before Ben fights in the All-Out ultimate fighting match!
Charlie uses some sophisticated graph theory and statistical techniques to analyze the win/loss ratios of the main fighters involved in the mixed martial arts league, and discovers a disturbing trend - the fighters rising to the top aren't necessarily those that are the best, just those that have had their schedules managed the most judiciously. One of the techniques Charlie uses, Kruskal's algorithm, we can also get our hands on!
Let's start with a more basic subject though - what is graph theory? To talk about the algorithm, we first have to know what Charlie even means when he's talking about "graphs"!
Graph Theory and Combinatorics: First Definitions
Combinatorics: The Math of Counting
One of the main branches of mathematics is a field called "combinatorics" - essentially, this is the study of counting. Before you laugh at the idea that someone could devote their life to something as simple as "counting," try and figure out these quick questions and see how easy/hard they really are:
- If seven people walk in to a restaurant and hand their hats to the attendant, how many ways can the attendant hand back their hats so that no person gets their own hat?
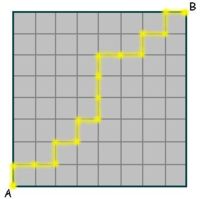
- How many ways are there of walking from the point (0,0) to the point (30,40) in the plane if we can only take steps of length one to the right or one up, i.e. steps of the form (1,0) or (0,1)?
- How many ways can you make a committee of ten students out of a group of 100 students (50 seniors, 50 juniors) and you have to choose three of them to be seniors and one student (either a senior or a junior) to be the committee head?
- How many ways are there of handing out thirty pieces of candy to twelve kids if no kid can get more than five pieces of candy and everyone has to get at least one?
While you might be able to figure out how to get the answer to some of these through brute force, hopefully they've given you an idea of how counting things can be really, really hard!
When we talk about a graph in this case, we don't mean the "graph of a function." We mean an entirely different type of graph.
Definition: A graph is a set of vertices V and a set of edges E between them.
Graphs of this form are of significant interest in combinatorics - in fact, hundreds of books and papers are devoted to studying their properties! Here's a few sample small graphs (all on four vertices, the pink circles):
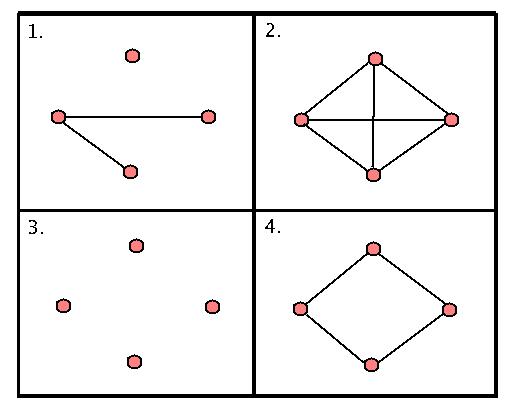
Let's look at these for a minute. The first graph only has two edges, and one "isolated" vertex (meaning there's a vertex that's not connected to any other vertex by an edge.) The second graph has no isolated vertices - in fact, every possible edge is already there. The third graph has no edges (and hence, four isolated vertices.) We say that this is "totally disconnected." The fourth graph is just a loop of length four (we call these "cycles".)
How many cycles does the second graph have? Well, this is a bit of trick question. If we're allowed to go over the same edge more than once, then it has infinitely many. If we're not allowed to go over the same edge more than once, then there are only cycles of lengths three and four in the second graph. How many cycles are there total?
Activity 1: Trees
While there are hundreds of classes of graphs that combinatorialists (mathematicians that study counting, deep down) would find of interest, two classes of graphs in particular that are worth looking at are "trees" and "chordal graphs." A tree is a graph where there are no cycles - essentially, these are the graphs that if you put your pencil down on one of the vertices and start traveling along edges, if you never double back, you can NEVER get back to the same vertex, no matter which vertex you started with! These graph have no loops, but while they sound easy, they can get pretty complicated pretty quickly. Here are some examples:
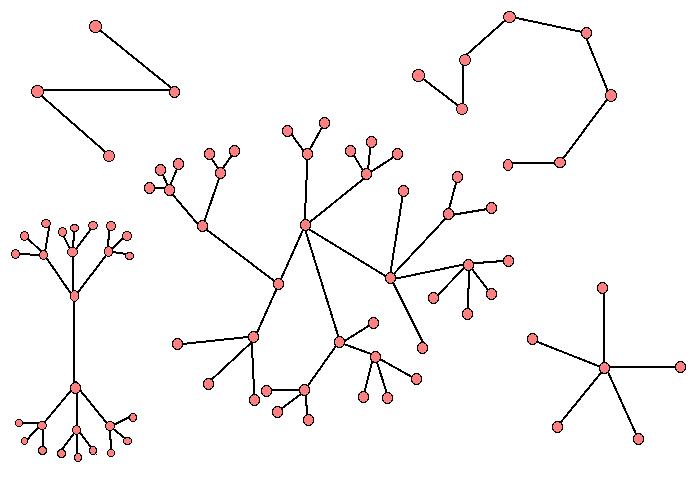
Trees show up pretty often in the construction of networks, although most often it's in the context of taking a given graph G and trying to remove edges from it until we wind up with ONLY a bunch of trees (so we are trying to get rid of all of our cycles!) We'll get back to this in a bit when we talk about Kruskal's algorithm.
JPG
- Draw a graph with five vertices and as many edges as you like. How many edges can you have and still have your graph be a tree? What's the largest number of edges your graph can have?
- Repeat 1. with six vertices.
- For a graph with n vertices, how many edges can you have and still have a tree? What's the largest number of edges your graph on n vertices can have?

Graphs show up just above everywhere - from networks and connections to travel planning, they're entirely ubiquitous. However, given an arbitrary graph, it might be really, really complicated. We'd like to look at subset of our graph that are a little more manageable.
Let's go back to looking at general graphs for a minute. Given an arbitary connected graph G (where connected just means that given any two vertices, we have some path we can walk along edges to go from one to the other,) we don't necessarily have a tree - in fact, trees are relatively rare among the class of all connected graphs. However, we CAN take our original graph, and gradually remove edges until we get down to a subgraph that is a tree - in fact, we can do this and end up with a graph that's still connected! Let's look at a particular graph and see how this works.
Spanning Trees and Subgraphs
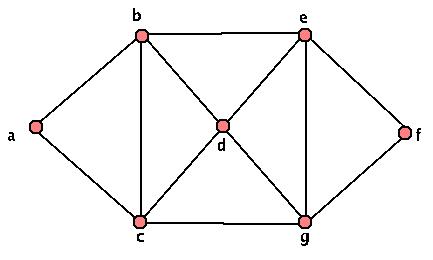
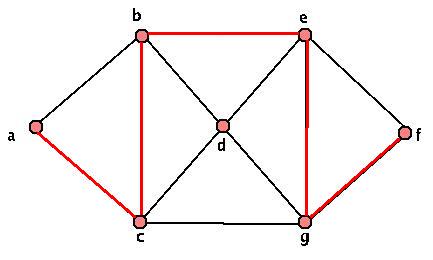
This graph is clearly not a tree. However, we can pick something called a "spanning tree" inside our graph G. Just start by looking at your graph, and coloring in one edge at a time. If adding an edge will give you a cycle, skip that edge and check another one. Add in any edge that doesn't give a cycle. Keep doing this until ANY edge you add will make a cycle - then check out the edges you've labeled. If your graph was connected, then EVERY vertex has at least one edge that you've colored in touching it - and by construction, you have no cycles. So you have your "spanning tree" inside your graph! We call this kind of object (a graph on the same set of vertices and containing only SOME of the same edges and no others) a "subgraph" of our original graph. Here are a few sample spanning trees of our graph above:
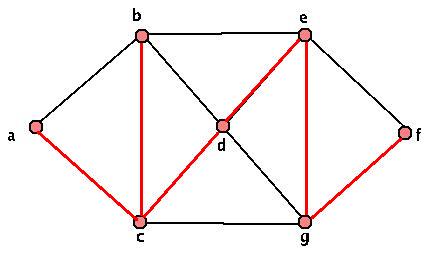
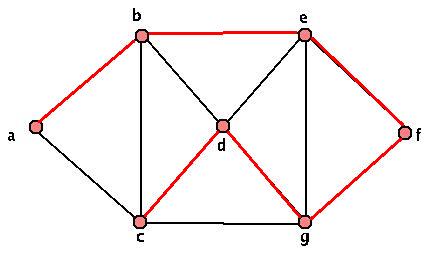
The red highlighted part of the graphs above are our spanning trees. There are lots of other spanning trees though. As a small exercise, find at least three more distinct spanning trees. We'll eventually want a more specific algorithm to pick out "nice" spanning trees, but for now, while we work with unweighted graphs, this is fine.
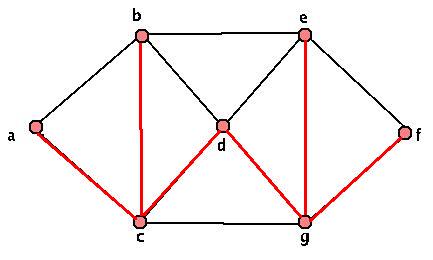
Before we move on, here are some examples of subgraphs of our original graph that aren't spanning trees. Look at each of them, and explain why.

Activity 2: Chordal Graphs
The other class of graphs, "chordal graphs" (also known as "triangulated graphs") are graphs which have the special property that if we have a cycle of length greater than or equal to four, there MUST be some "chord" - an edge that connect two vertices more closely than in our original cycle. Let's look at what this means. Here are four examples of graphs, with two chordal, two not chordal.
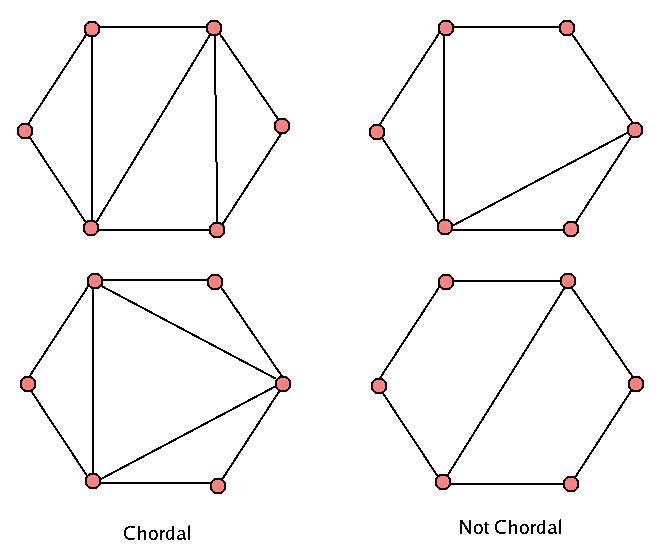
- Looking at the two on the right, you can see that in the top one, there is one cycle of length four that has no smaller cycles in it. In the bottom one, how many such "too big" cycles are there?
- If we look at the ones on the left, we see that any cycle of length four or larger MUST have a smaller cycle to break it up - and can you see why these graphs are called "triangulated"?
- Make a couple of graphs yourself on seven vertices, both chordal and non-chordal. Do you see how to turn a non-chordal graph into a chordal graph by adding edges?
Weighted Graphs and Networks
So far, we've been talking about simple graphs G. The only data we have is which edges connect different vertices. However, there's another natural extension of simple graphs that arise constantly in scientific and commercial applications constantly. The graphs, called "weighted graphs," also encode information about how much each edge "costs" to cross or use.
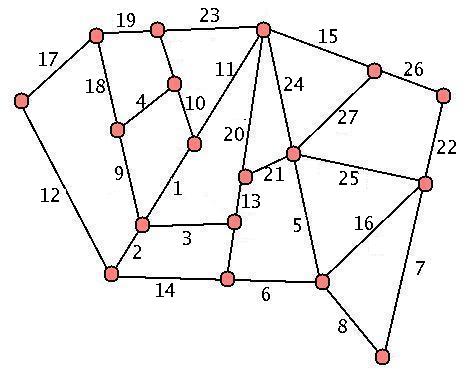
Here's our earlier unweighted graph. Compare that to a weighted version of the same graph (we just assign positive values or "costs" to each edge.)

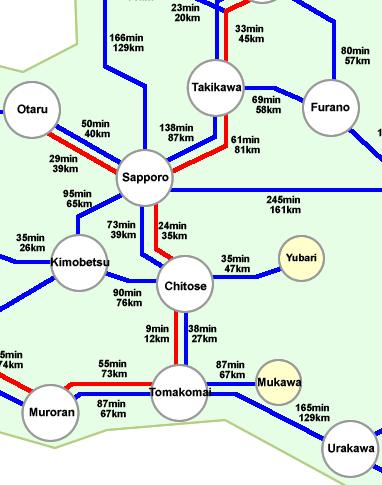
Easy enough, right? Weighted graphs are frequently used to measure cost to travel or transport goods from place to place, or to measure flow of information or commodities in a given grid. You've probably run into weighted graphs yourself - for example, on most paper maps either driving times or distances are given between exits or major cities. The places where roads intersect form the vertices, and the roads form the weighted edges. When MapQuest or Google Maps is calculating the best route to take from point A to point B, they're also using the weighted graph of roads and location hubs, then minimizing travel time using sophisticated search methods.
The map to the right is a little more sophisticated than a basic weighted graph - now we have two different "types" of edges, both express and local. However, we can safely ignore this complication when considering this map if we restrict our attention to the blue edges.
Kruskal's Algorithm and the Construction of Minimal Weighted Spanning Trees
One question that you'd probably be interested in is how to construct "minimal" spanning trees for these graphs. Before, when we were constructing spanning trees for our graphs, we just kept picking edges until we couldn't pick any more - and at that point, we were done, possessing our very own spanning tree for our original graph. Now though, different spanning trees won't necessarily be "worth" the same amount - if we add up the values along the edges in two different spanning trees of our graph G, one might be cost way more than another to have goods or information flow along our edges.
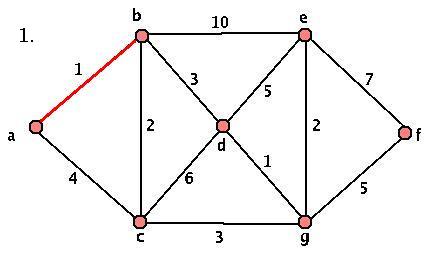
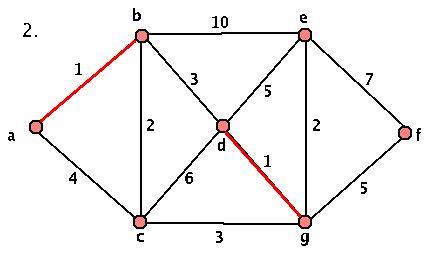
Kruskal's algorithm gives us a way to compute minimal spanning trees of our weighted graph - and it's pretty easy to do too! Start with your original weighted graph G.
- Pick an edge of minimal weight. Choose this one for your minimal spanning tree.
- Consider your graph minus this edge. Choose the next minimal edge in the remaining graph. Add this one to the spanning tree, unless by adding it, we make a cycle in our constructed subgraph.
- Repeat, choosing the edge of minimal weight that doesn't give us a cycle at every stage from among the edge that aren't part of your chosen spanning tree.
- Stop when we can't add any more edges.
This algorithm will always terminate (we add an edge at each stage, and we only started with a finite set of edges) and will always produce a minimal spanning tree. However, we DO have some choice at each stage, so our spanning trees aren't necessarily unique. Here's a sample graph and a demonstration of the algorithm:
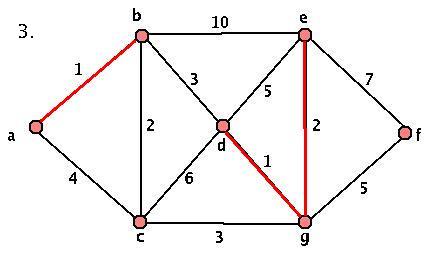
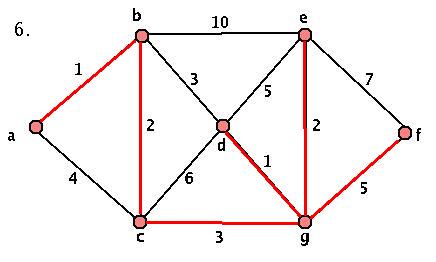
Activity 3: Applying the Algorithm
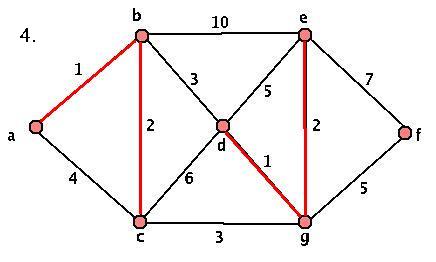
- Given the graph G above, where's the first stage that we have a choice? What about a choice that makes a difference in our final graph? Start at the key step and construct the OTHER minimal spanning tree.
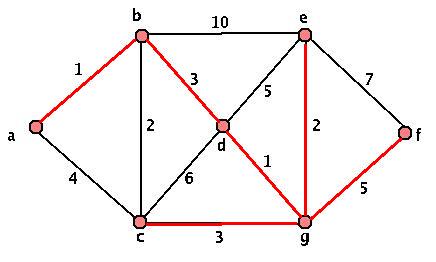
- Look at the graph below. What stage in the algorithm did someone go wrong at? Is this a minimal spanning tree?
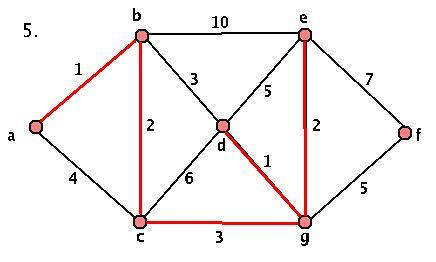
- Consider the next graph. Split up into partner groups, and repeat the algorithm on this graph - but try it separately first. Can you explain to your partner in words why this algorithm will give you a minimal spanning tree? How many different minimal spanning trees did you and your partner come up with?
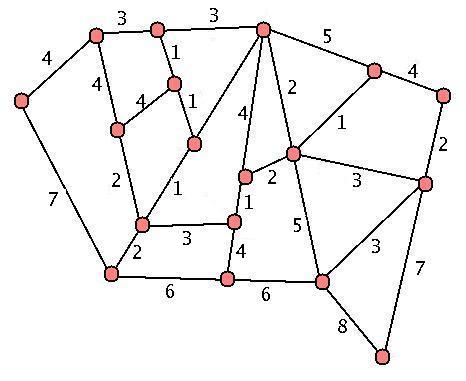
- Can you explain why the graph below must have only ONE minimal spanning tree?