Section 1 - Plots of probability vs max cluster size
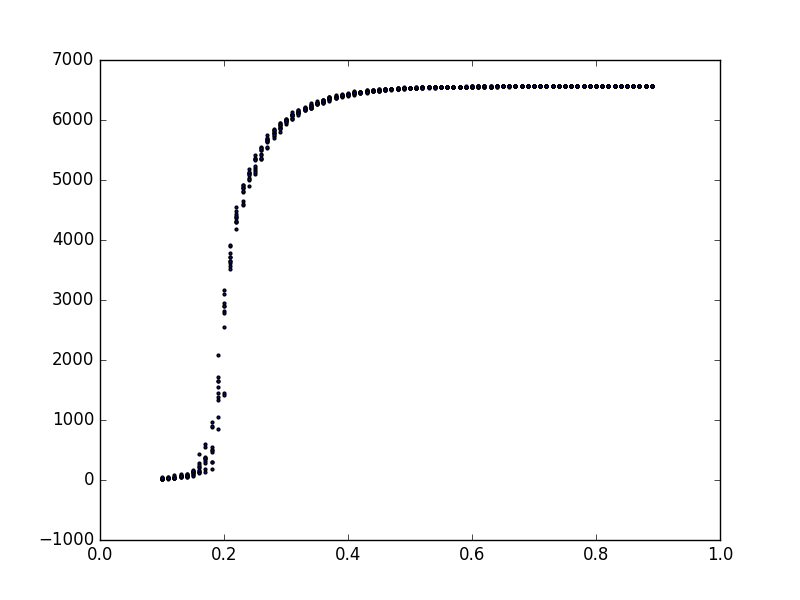
Fig. 1 - probability vs max cluster size on SG × SG
Experimental evidence suggests that the critical probability for products of Sierpinksi Gasket fractafolds is near .185
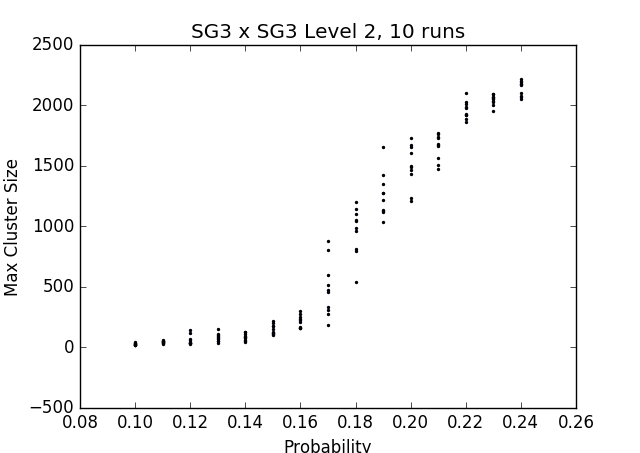
Fig. 2 - probability vs max cluster size on SG3
Experimental evidence suggests that the critical probability for products of Sierpinksi Gasket cell graph fractafolds is near .17
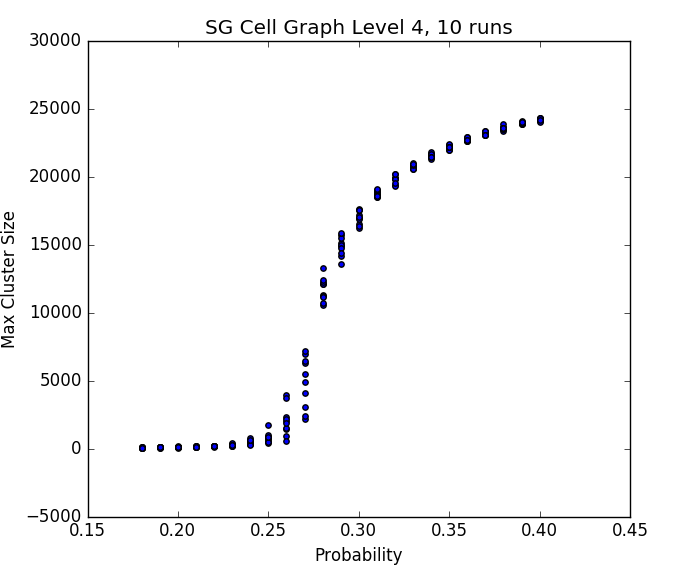
Fig. 3 - probability vs max cluster size on the cell graph version of SG X SG
Experimental evidence suggests that the critical probability for products of Sierpinksi Gasket cell graph fractafolds is near .275
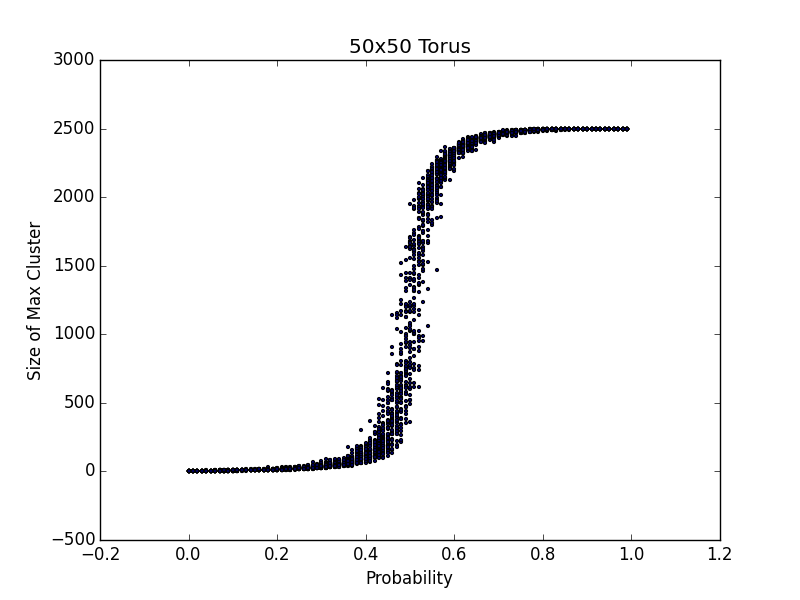
Fig. 4 - probability vs max cluster size on the torus graph
Results of our experiments fall in line with Kesten's proof that the critical probability for the infinite square lattice is .5. Note that we identify endpoints of our lattices to form a torus in order to eliminate its boundary points and force them to be 4-regular. In this way, they better represent the infinite lattice.
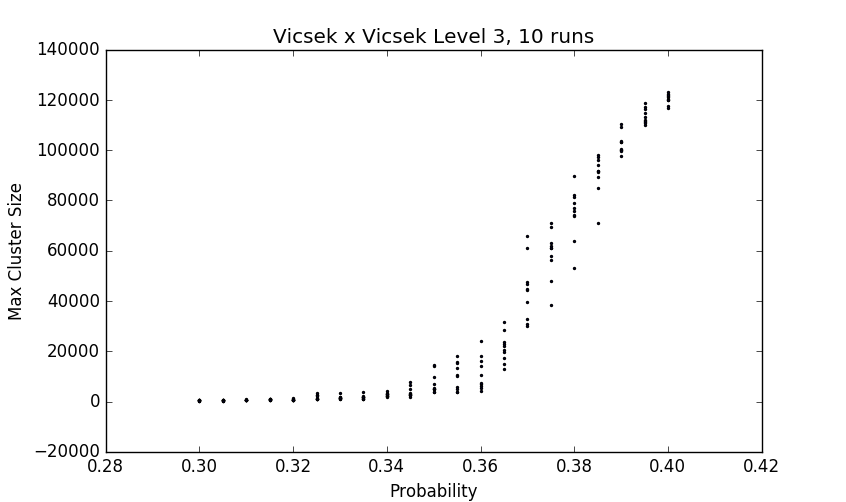
Fig. 5 - probability vs max cluster size on the Vicsek set
Experimental evidence suggests that the critical probability for these graphs is near .37
Section 2 - Locating phase transition by finding spanning clustersPercolation theory on infinite graphs posits that in the supercritical phase we will see infinite max clusters in the parent graph. In the case of finite graphs, we could say that the analogue of an infinite cluster is one that extends from one side of the boundary of the graph to an opposite side of the boundary. We can then try to locate the phase transition by looking for the first time every run at a given probability produces a spanning max cluster. To define a spanning cluster, we use must define a boundary on the fractal product graph. To do this, take Q to be the set of boundary points in the root graph K (e.g. SG itself). Then we define the boundary of the product graph to be (K × Q) ∪ (Q × K). We then say a cluster spans its parent graph if it contains vertices on two non-intersecting sides of the boundary. Here, a side of the graph is defined to be K × {q} for some q ∈ Q.
Results on the SG × SG
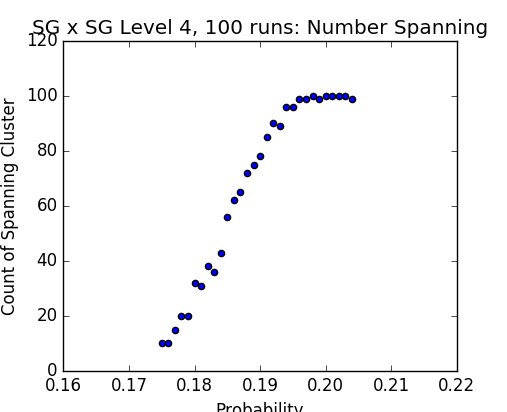
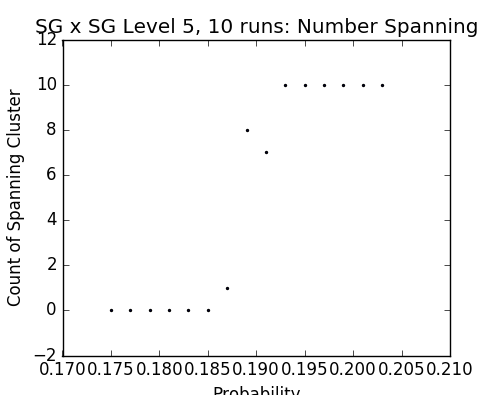 Figs. 6-8 - Probabilities vs number of spanning clusters on SG × SG
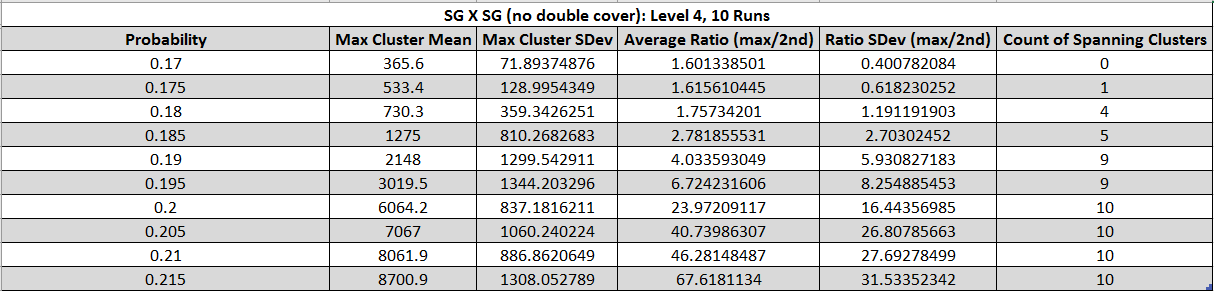
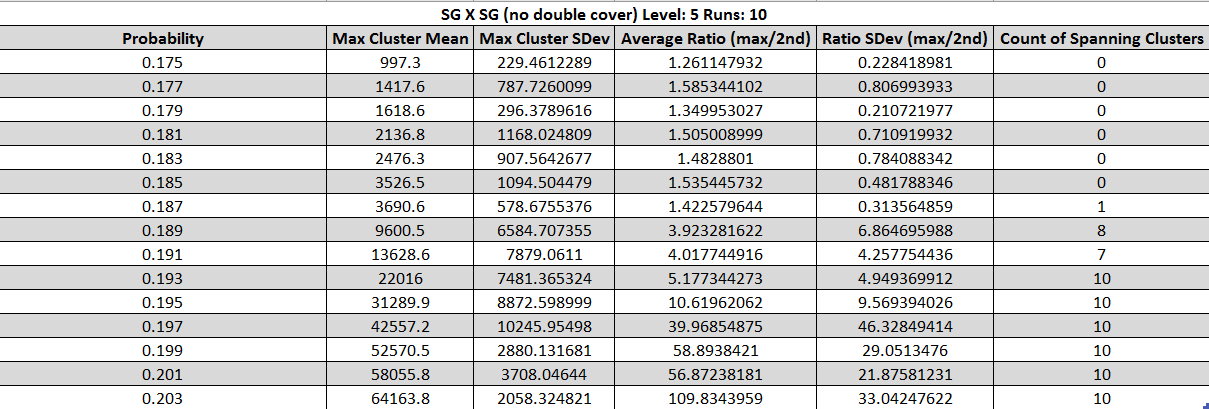 Fig. 9, 10 - Tables of statistics about spanning clusters of SG × SG
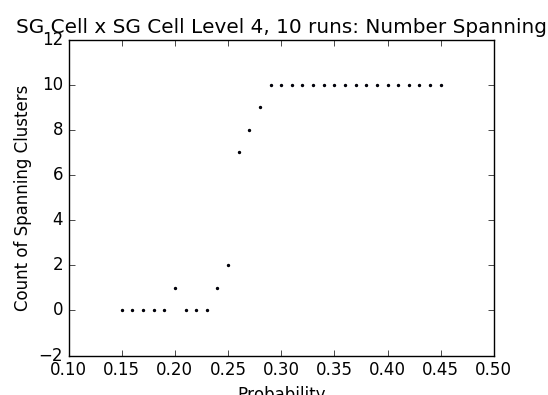
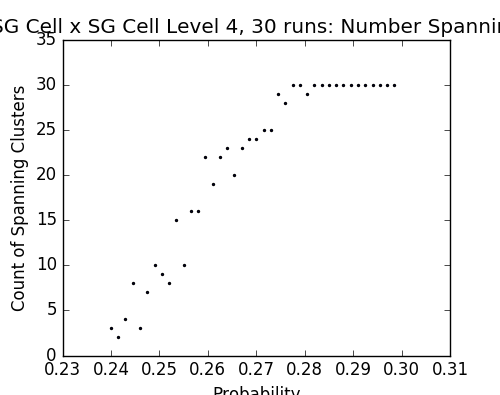
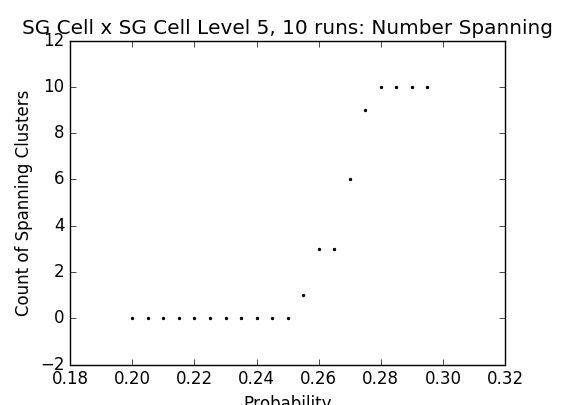 Figs. 11-13 - Probabilities vs number of spanning clusters on the cell graph version of SG × SG
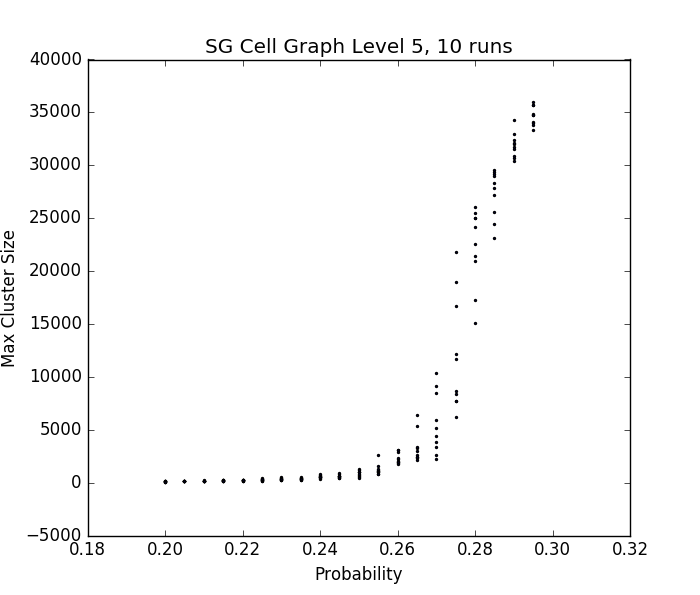
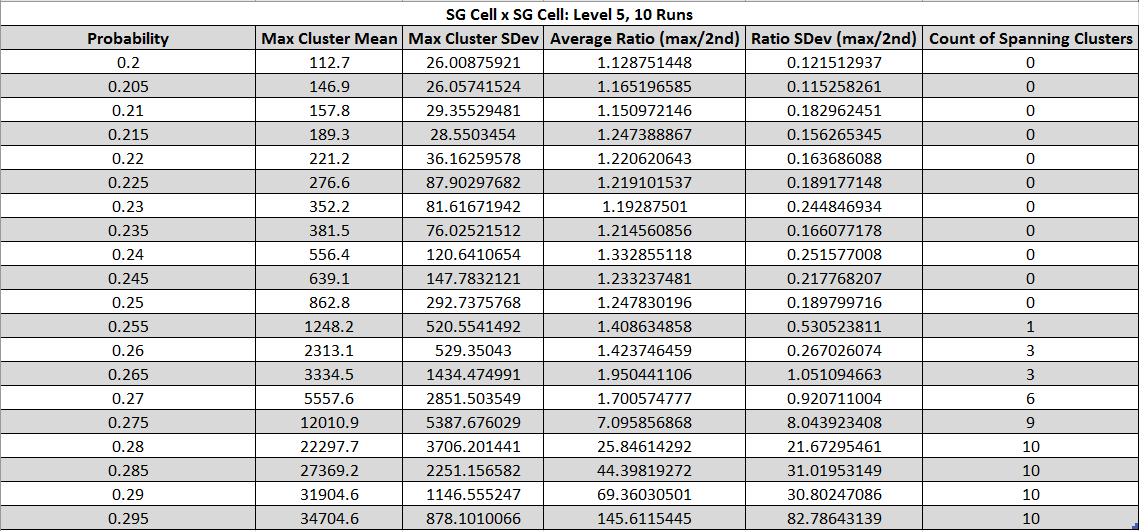 Fig. 14, 15 - Plot and Table of statistics about spanning clusters of the cell graph version of SG × SG
Results on the Mistubishi gasket (SG3)
Fig. 14, 15 - Plot and Table of statistics about spanning clusters of the cell graph version of SG × SG
Results on the Mistubishi gasket (SG3)
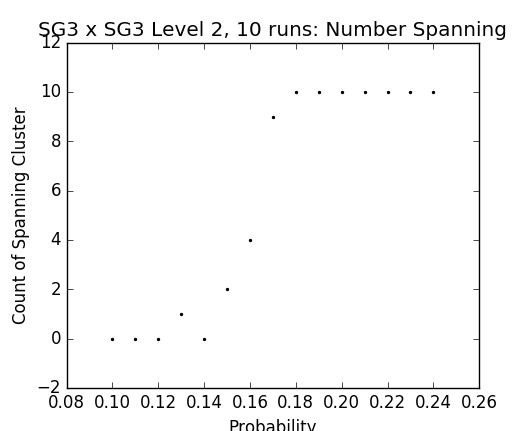 Fig. 16 - p vs number of spanning clusters on SG3
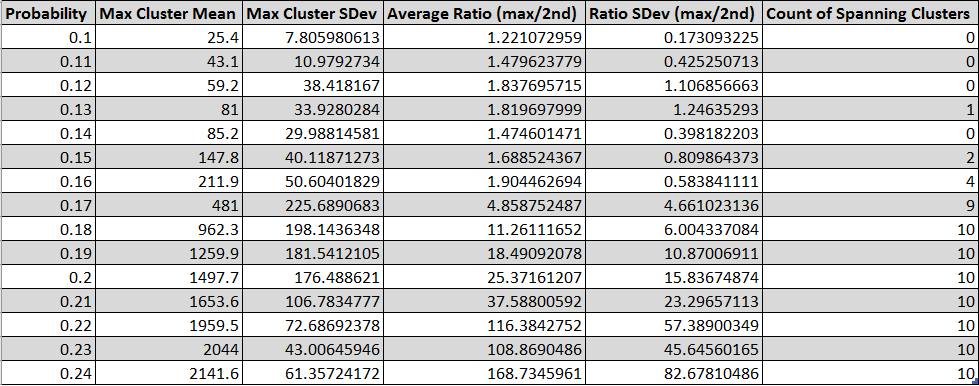 Fig. 17 - Table of statistics about spanning clusters of SG3 as p is varied
Results on the lattice (no torus identifications)
Fig. 17 - Table of statistics about spanning clusters of SG3 as p is varied
Results on the lattice (no torus identifications)
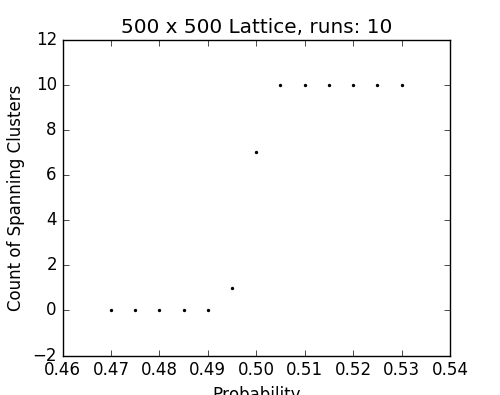 Fig. 18 - p vs number of spanning clusters in a lattice
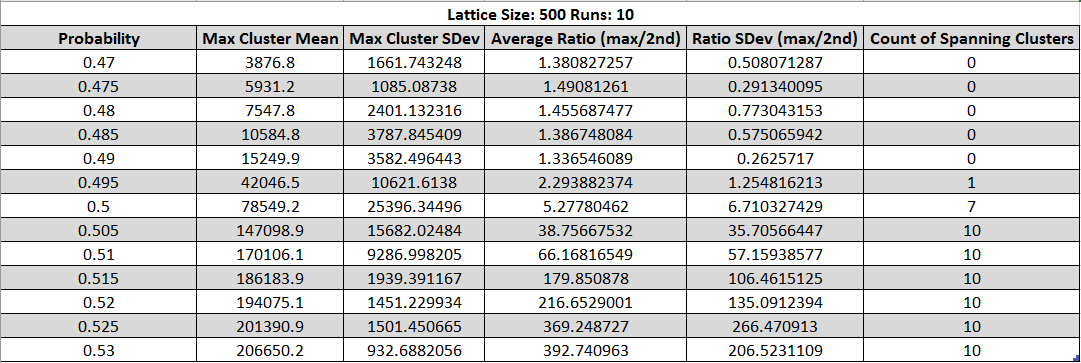 Fig. 19 - Table of statistics about spanning clusters of the torus graph as p is varied
Results on the the Vicsek set
Fig. 19 - Table of statistics about spanning clusters of the torus graph as p is varied
Results on the the Vicsek set
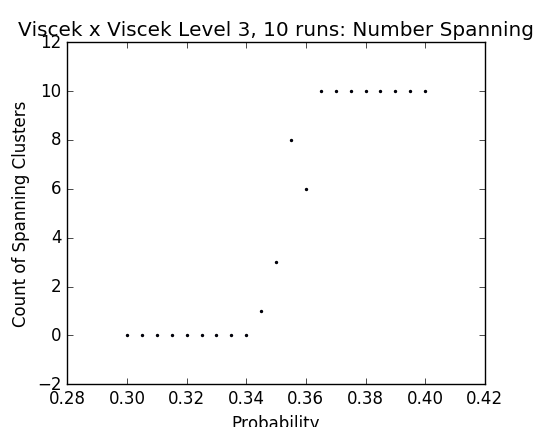 Fig. 20 - p vs number of spanning clusters in a Vicsek set
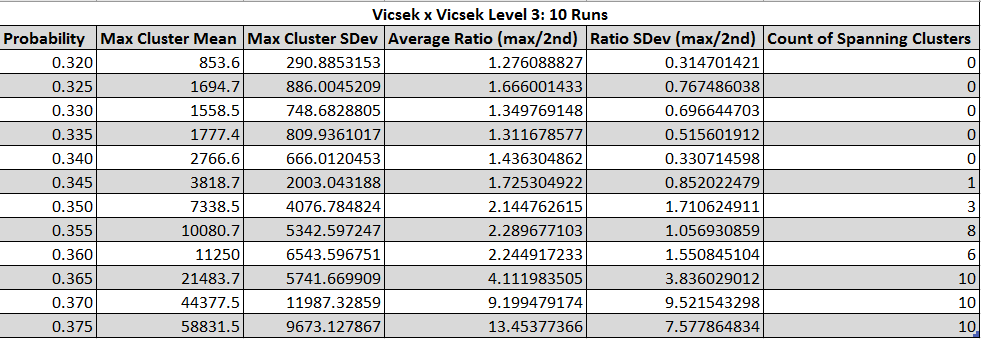 Fig. 21 - Table of statistics about spanning clusters of the Vicsek set fractal as p is varied
Results on the the Magic Carpet Graph
Fig. 21 - Table of statistics about spanning clusters of the Vicsek set fractal as p is varied
Results on the the Magic Carpet Graph
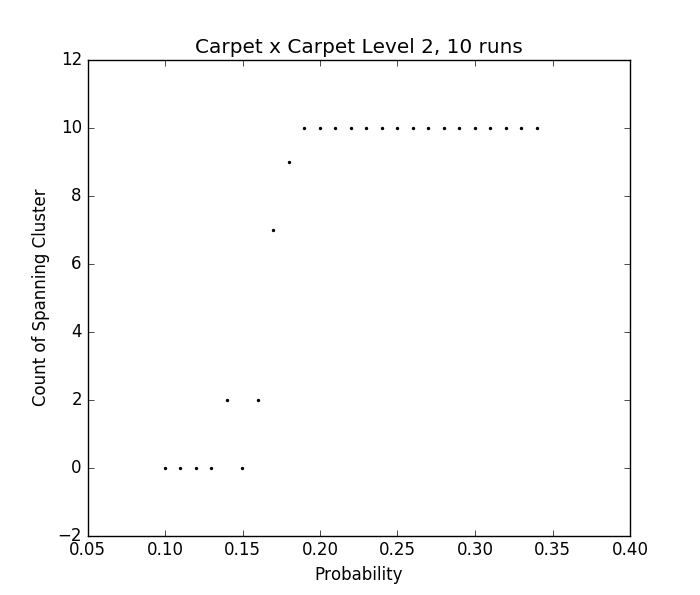 Fig. 22 - p vs number of spanning clusters in the Magic Carpet
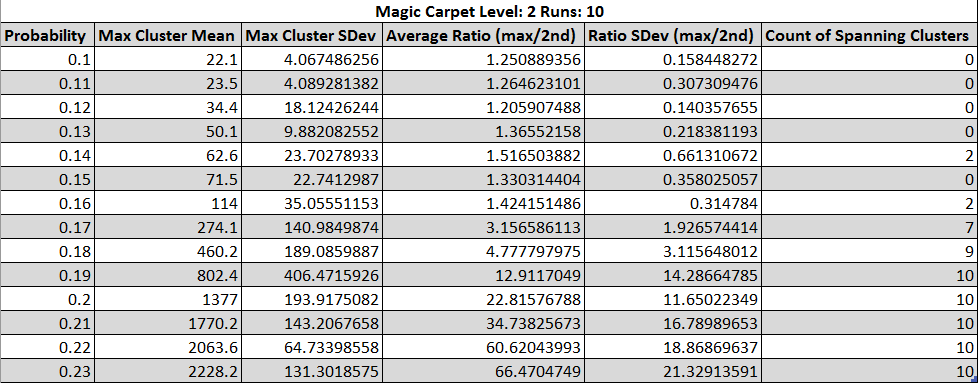 Fig. 23 - Table of statistics about spanning clusters of the Magic Carpet as p is varied
Section 3 - Locating phase transition by looking at cluster size ratios
Fig. 23 - Table of statistics about spanning clusters of the Magic Carpet as p is varied
Section 3 - Locating phase transition by looking at cluster size ratios Results on SG × SG
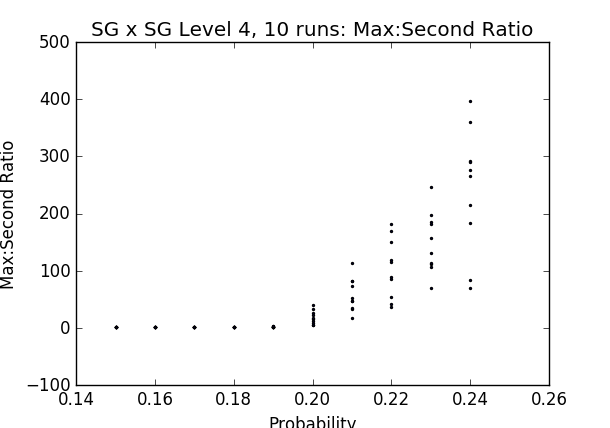 Fig. 24 - p vs ratio of sizes of largest and 2nd largest clusters in percolated SG × SG graphs
Results on the cell graph version of SG × SG
Fig. 24 - p vs ratio of sizes of largest and 2nd largest clusters in percolated SG × SG graphs
Results on the cell graph version of SG × SG
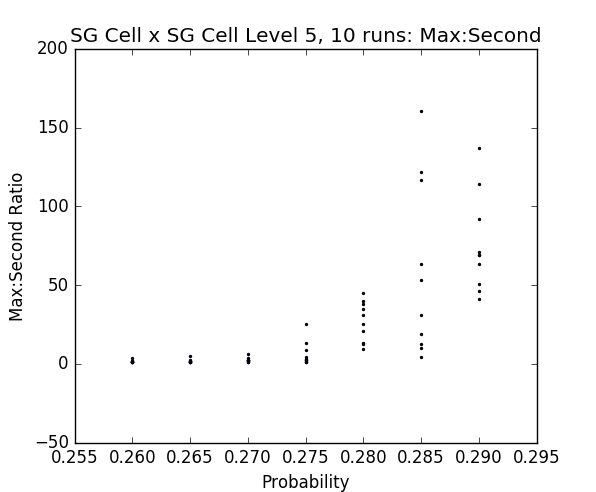 Fig. 25 - p vs ratio of sizes of largest and 2nd largest clusters in percolated cell graphs
Results on the the Mitsubishi gasket (SG3)
Fig. 25 - p vs ratio of sizes of largest and 2nd largest clusters in percolated cell graphs
Results on the the Mitsubishi gasket (SG3)
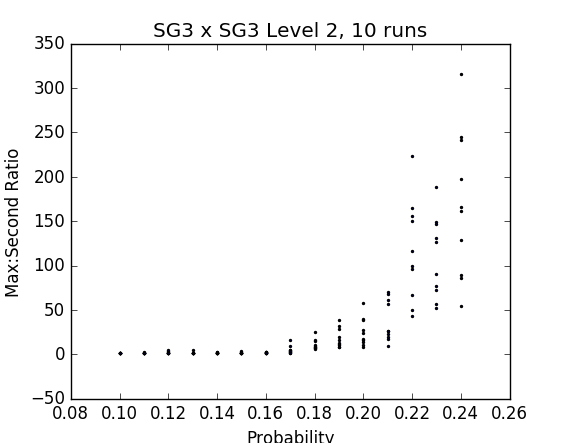 Fig. 26 - p vs ratio of sizes of largest and 2nd largest clusters in percolated vicsek sets
Results on the lattice
Fig. 26 - p vs ratio of sizes of largest and 2nd largest clusters in percolated vicsek sets
Results on the lattice
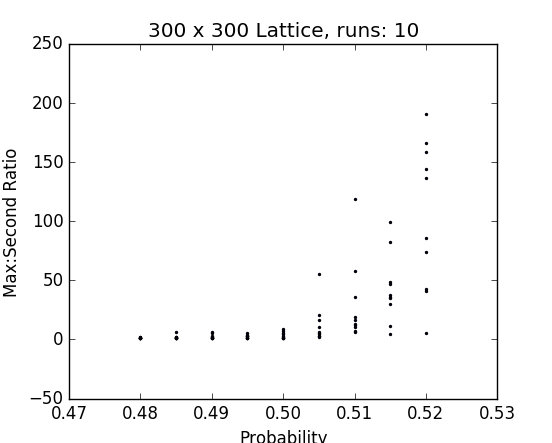
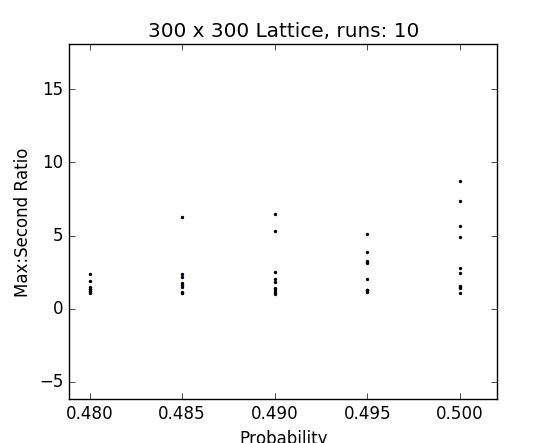 Fig. 27, 28 - p vs ratio of sizes of largest and 2nd largest clusters in percolated lattice graphs
Results on the Vicsek set
Fig. 27, 28 - p vs ratio of sizes of largest and 2nd largest clusters in percolated lattice graphs
Results on the Vicsek set
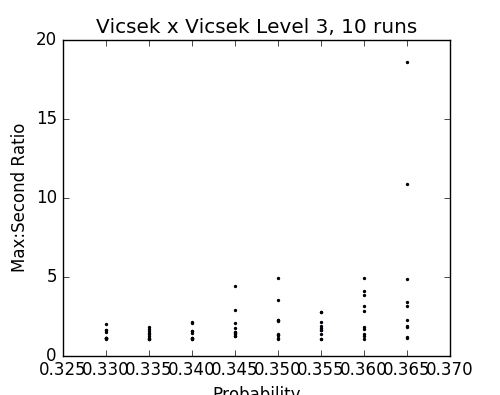
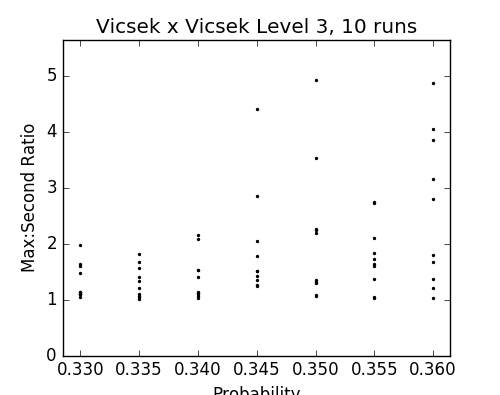 Fig. 29, 30 - p vs ratio of sizes of largest and 2nd largest clusters in percolated Vicsek sets
Results on the Magic Carpet
;
Fig. 29, 30 - p vs ratio of sizes of largest and 2nd largest clusters in percolated Vicsek sets
Results on the Magic Carpet
;
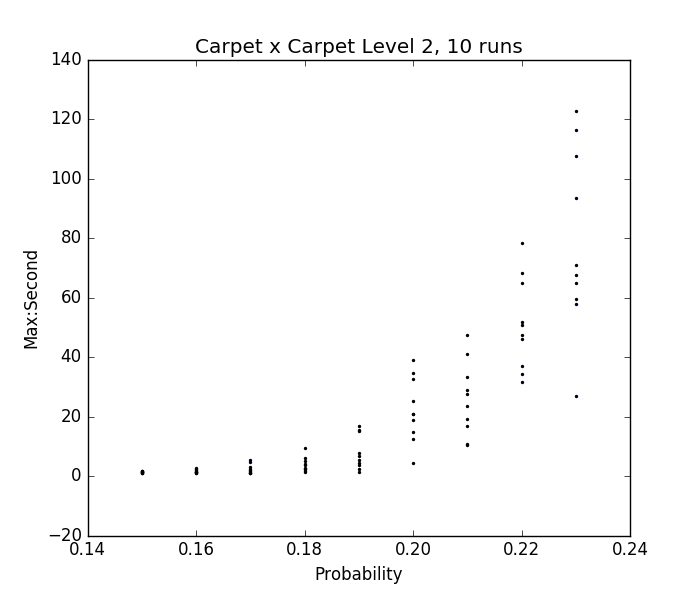
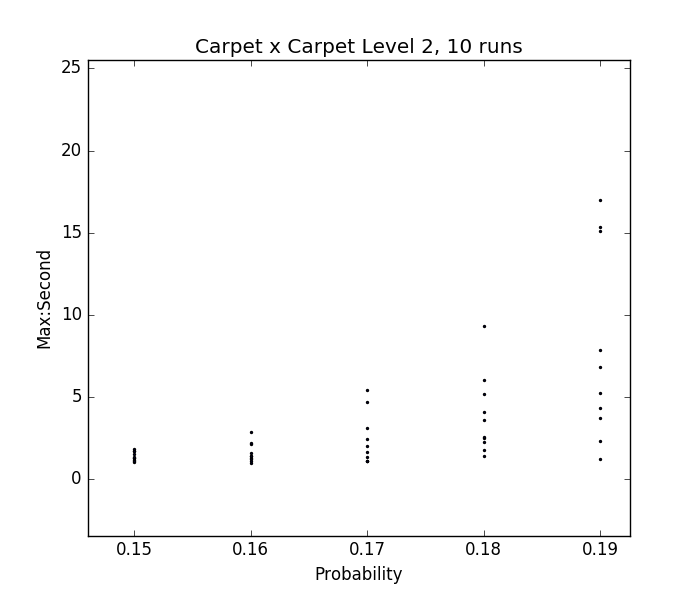 Fig. 30, 31 - p vs ratio of sizes of largest and 2nd largest clusters in percolated Magic Carpet