We begin with the regular graph Laplacian matrix G, which is like the adjacency matrix, but with node degrees on the diagonal and edges represented by -1.
In other words, it is G = D - A, where D is the degree matrix and A is the adjacency matrix.
We then obtain the probabilistic graph laplacian as P = D-1 G.
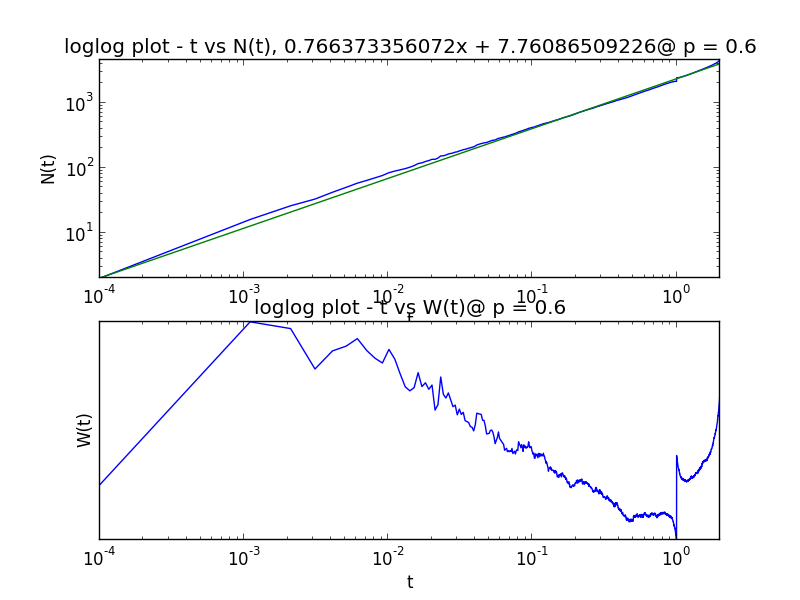
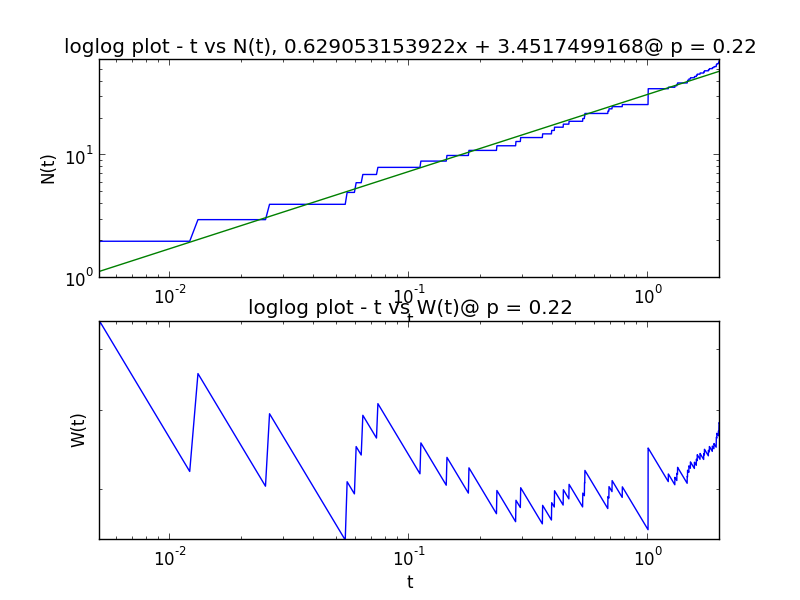
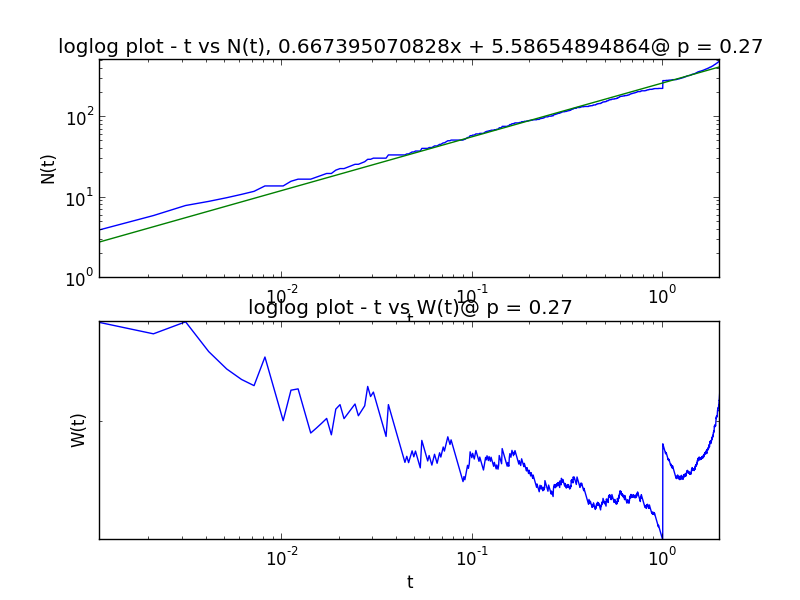
Now define the Eigenvalue counting function N(t) = #{λj ≤t}. If we plot this log-log, we see that the resulting curve is fairly straight and take that as evidence of a power law. Using a linear fit of the log-log plot, we then take the slope to be the associated power law exponent α. We then can compute the Weyl Ratio W(t) = N(t) / tα.
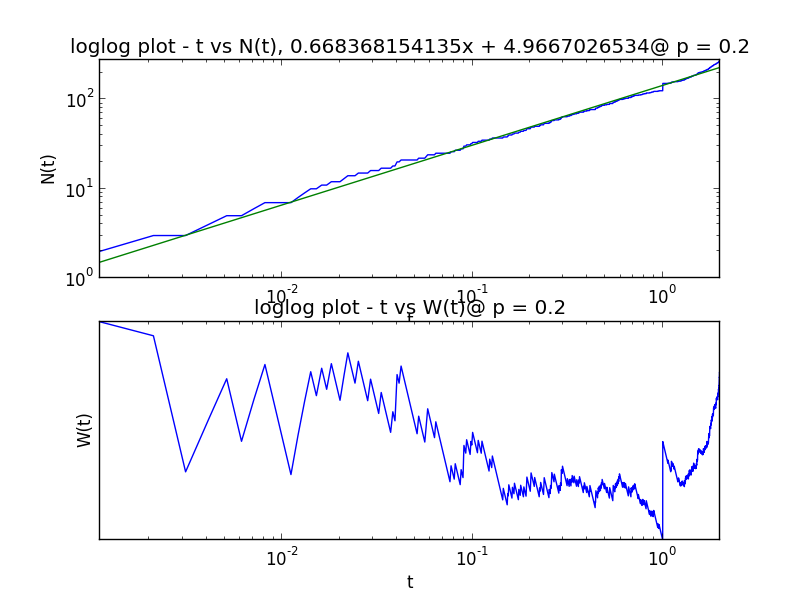
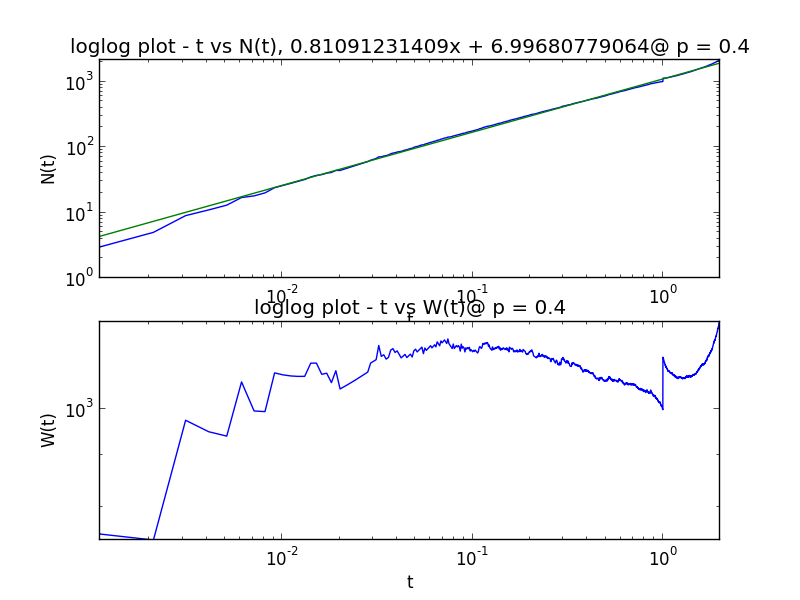
Figs. 1, 2 - A pair of plots of the Eigenvalue counting function and Weyl ratio for a random walk on a max cluster in the level 3 SG × SG. The left and right pictures come from random walks from graphs percolated at and just after the critical probability. See more HERE
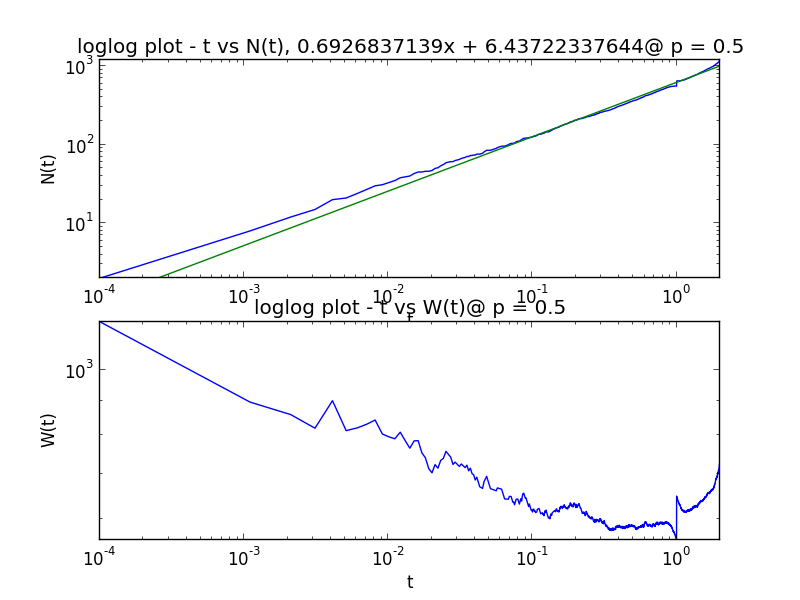
Figs. 3, 4 - A pair of plots of the Eigenvalue counting function and Weyl ratio for a random walk on max clusters in the 243 × 243 Torus graph. The left and right pictures come from random walks from graphs percolated at and just after the critical probability. See more HERE
Figs. 5, 6 - A pair of plots of the Eigenvalue counting function and Weyl ratio for a random walk on max clusters in the level 3 cell graph version of SG × SG. The left and right pictures come from random walks from graphs percolated at and just after the critical probability. See more HERE