8. GRAPHING THE RELATION OF TWO GEOMETRIC QUANTITIES DIRECTLY--WITHOUT WRITING AN EQUATION.
Given triangle
ABC. Let C move along a line segment
DE. How does the area change as C
moves? Think about DE being parallel
to AB. Then DE not parallel.
With Sketchpad you
can compare DC and the Area in several ways.
You can animate the
figure as C moves along DE, and watch the area change
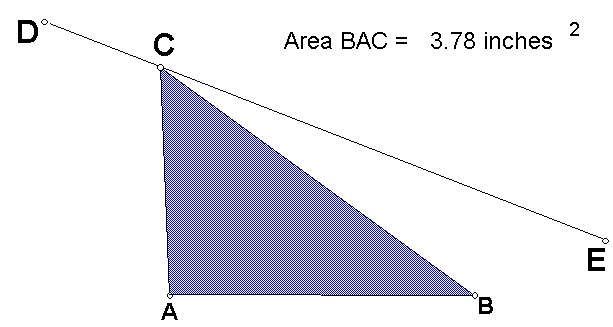
You can graph the relation of Area(ABC) to some specific length: such as the length of AC, or the distance DC.
·
What would a graph of Area(ABC)
vs. DC look like? Why?
·
What would a graph of Area(ABC)
vs. AC look like? Why?
·
How do the graphs change If DE Is not parallel to AB? Why?
You can use the coordinate
axes on Sketchpad and plot point (x,y) using y = Area and x = length. Or, you can construct our own geometrical
representation of Area vs. length
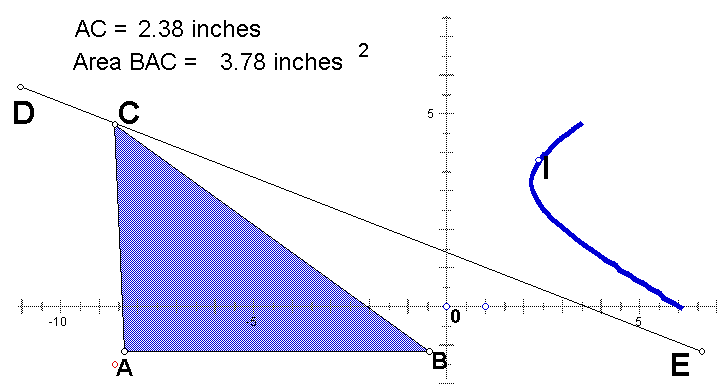
Here
we have plotted Area of Triangle ABC vs. DC.
Why
does the graph turn around?
For
what position of C does it turn around?
Here we have plotted:
Area
(BAC) vs. CA thick
curve
Area
(BAC) vs CD linear
CA
vs CD thin
curve
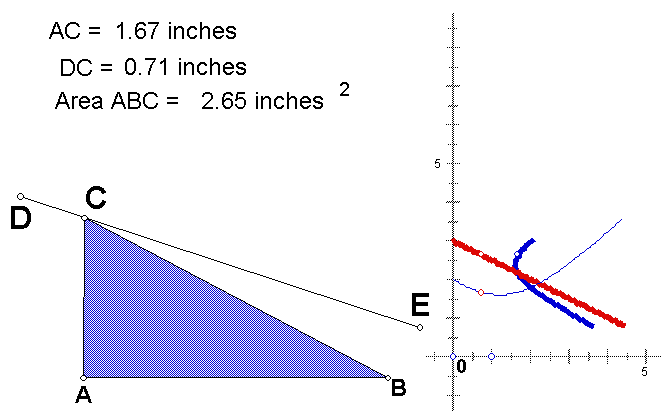
How do you make sense of the
relation of the three plotted points as C moves along DE?
Try plotting (for DE parallel
to AB):
Area
(BAC) vs. CA thick
line
Area
(BAC) vs CD thick line
CA
vs CD thin
curve
Notice that the Area vs. CA
or CD gives same line, but the locus point is different. This shows up as you move C.