Numb3rs 216: Protest
The only significant mathematical content in this episode was a brief
discussion of social networking. We'll talk about an example of an experiment
involving social networking and of a mathematical method to identifying
important nodes in social networks.
Social Networks
The basic idea of social networks is to represent the interactions beween
a group of people by a mathematical structure called a graph. A
graph is given by a set of vertices (also called nodes), and a set
of pairs of vertices, called edges. To model friendships (or other
types of interactions) among a group of people, we have one node for each
person and an edge between each pair of people who are friends. Now we can
talk about various quantities related to the graph or particular vertices.
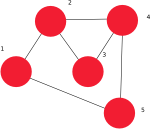
For example, we can count the number of edges at each vertex, the distance
between two different vertices, etc. Here is an example graph.
Another way we can represent a graph is using matrices. If you
aren't familiar with matrices, they came up in another Numb3rs show and
are described here.
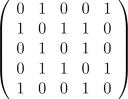
If there are n vertices in the graph, we
can number them 1 through n and then make a matrix where the number
in row r and column c is 1 if there is an edge between
vertex r and c and 0 otherwise. Notice that this matrix will
be symmetric, which means that if you flip the matrix across the
diagonal from the upper left to the lower right, you get the same matrix.
The matrix representation for a graph can be useful for some types of
computations. The matrix below represents the graph illustrated above.
Describing social networks mathematically has allowed various types
of math to be applied. This has been done for many various applications,
including uncloaking criminal networks amongst slumlords, revealing
how hospital-acquired infection[HAI] spread amongst patients and medical
staff, finding emerging leaders in fast growing companies,
studying the spread of HIV in a prison system,
expose business ties and financial flows to investigate possible
criminal behavior, etc. As another example, researchers interviewed 800
students in a high school in the Midwest and asked them who they had had
sexual experiences with. Then they drew a
graph
where the nodes were people
and people who had had sexual experiences with each other were connected with
an edge.
Activity 1:
- What conclusions can you draw from the graph of the sexual relations
at the high school? How should this graph affect how students are
educated about STDs?
- What other ways do you think social network analysis could be applied?
Stanley Milgram Experiment
In the early 1960s Stanley Milgram was interested in testing the
"Six Degrees of Seperation" hypothesis, which states that
if you look at the social network of the whole world, then there is a path
between any two nodes that has length at most 6.
The hypothesis that Milgram was testing is actually known
to be false
because there are some societies that actively avoid contact with the
rest of the world. An example of this is the
Sentinelese, a tribe
of a few dozen to a few hundred people on a small island near India. They
have been very hostile to any visitors, so very little is known about them
at all. In particular, as far as anybody knows none of the people on
the island are friends with anyone off the island.
Activity 2:
If you assume that at each node there's a certain
probability p that the node won't send on the letter, then short paths
are more likely to be completed than long paths.
- If a path has length n (i.e. it crosses n edges), what
is the probability that it is completed?
- Let's say that given a starting point in the graph, the odds that the
path from the point to the final point has length n are given by
the formula
 , where A,c are constants
and 0 < c < 1. (We choose A so that
, where A,c are constants
and 0 < c < 1. (We choose A so that  .) What is the
average length of a path in the network?
.) What is the
average length of a path in the network?
- Using the formulas in the previous question, what is the average length of
a completed path?
Another problem with Milgram's study is that people had to choose which
one of their friends to send the letter to. Since they couldn't possibly
know all of their friends connections, they weren't able to choose the
most efficient route. In fact, from looking at the data it seems that most
people decided to send the letter to one of their friends that was
geographically closer to the target then they were. Once the letter arrived in
the right town, it often moved around fairly randomly until it happened to
get to one of the target's friends. This would cause Milgram's experiment
to overestimate the minimum length of a path between two random people.
Even with these difficulties, this experiment has encouraged much research
into networks and graphs, particularly graphs with the small world
property. This is the property that any two nodes in the graph can
be connected by a short path. In a paper in 1998, Duncan Watts and Steven
Strogratz wrote a paper that many networks, both natural and manmade, are
small world networks. They also showed that if you start with a lattice and
add a few random edges that the diameter (length of the longest path) of
the graph goes from being very long to very short. This is a common
occurance in mathematics - often there is experimental evidence to support
some conjecture, but an actual proof of it can take a very long time to
be discovered.
Eigenvector Centrality
In the last section we talked about one measurement of graphs, and social
networks in particular, the average distance between nodes. In this section
we'll talk about eigenvector centrality, which is a measure of the
importance of nodes for the connectivity of the network. Eigenvector is
a word which is derived from the German word "eigen," which
means self, and the word "vector" which means vector.
Given a matrix A, an eigenvector for this matrix is a vector v
that satisfies the equation Av = av for some constant a.
We'll call the importance of each node its centrality score, and
to measure this we'll want the centrality score to be proportional to the
sum of the scores of all nodes which are connected to it. This way, if a
node is connected to many important node, it will also be an important node,
and if it is connected to only a few unimportant nodes then it won't
be important. Writing this mathematically gives the equation
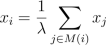 , where
  means that the sum is over all j
such that the nodes i, j are connected. Another way to write this
formula is using the adjacency matrix. If we let x be the vector
that has the centrality score of node i in component i,
then the above equation can be rewritten as the equation
means that the sum is over all j
such that the nodes i, j are connected. Another way to write this
formula is using the adjacency matrix. If we let x be the vector
that has the centrality score of node i in component i,
then the above equation can be rewritten as the equation
 . In general, the matrix
A will have multiple eigenvalues (the number
. In general, the matrix
A will have multiple eigenvalues (the number  is called an eigenvalue), but the
Perron-Frobenius theorem guarantees that if we demand all the components of
the eigenvector x be positive, then there is only one eigenvalue
that satisfies this requirement. Therefore we can assign a unique
centrality score to each node.
is called an eigenvalue), but the
Perron-Frobenius theorem guarantees that if we demand all the components of
the eigenvector x be positive, then there is only one eigenvalue
that satisfies this requirement. Therefore we can assign a unique
centrality score to each node.
Activity 3:
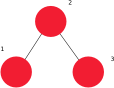
- Figure out the adjacency matrix A for this graph.
- Use the equation
to determine the centrality scores for the nodes of this graph. (Hint: if
you have a computer calculation system like Mathematica or a fancy
enough calculator, you can use the computer to calculate the eigenvalues
and eigenvectors of a matrix and save yourself some time.)
- Do the centrality scores for the nodes accomplish our goal of giving
more connected nodes higher scores?
- Do the same thing for the graph at the top of the page. For this you'll
definitely want to use a computer to calculate the eigenvalues and
eigenvectors.