Math Explorers Club

Graphs are Everywhere
Friday, January 30, 2009
What is a graph? There are a number of different ways that scientists, engineers and mathematicians use the word “graph” (graph of a function, a graph of data, etc.) For our purposes, we are going to be talking about a very specific object which we will call a graph.
Definition: A graph is a pair (V,E) where V is a set of vertices (points) and E is a set of pairs of these vertices (edges).
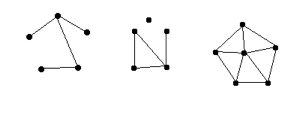
Here are a few very basic examples:
While the definition may seem a little abstract, as soon as we see pictures we realize that it’s not so bad. These objects occur naturally in the real world in thousands of places. Let’s look at a few examples.
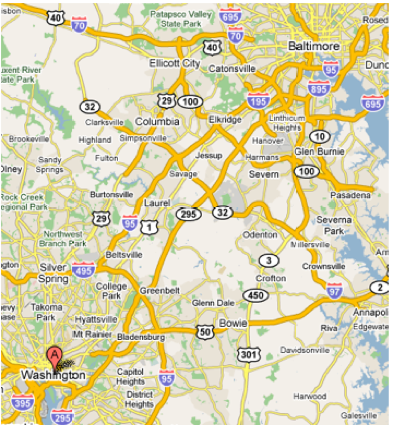
Example 1: Ways of Going from Baltimore to Midtown Washington D.C.
Each of the different places that roads intersect can be viewed as a vertex in this graph, and each of the roads running between these intersections are the edges. We could even make this graph have more information by adding either distances between our vertices (distances on the road between those two points,) or adding travel times between the vertices. Having that, we could answer an obvious question that’d come to mind - what’s the shortest route between our two cities?
We’ll come back to this problem in general in a later page, where we will encounter it as the Traveling Salesman problem. On to our next example!
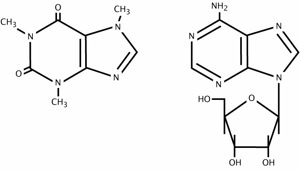
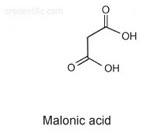
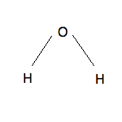
Example 2: Molecule Diagrams
We can represent the atoms in a molecule as the vertices in our graph, and the bonds between our atoms as vertices. Some basic molecules (ones who have only single bonds between atoms) qualify as graphs of the type discussed above.
To be able to fully describe molecules, we’d have to allow graphs that had multiple edges between vertices (a generalization of a graph called a “multigraph.”) Here are a few more examples of molecule diagrams, this time allowing for double (or higher) bonds. The ones on the left are versions of caffeine!
Exercise: Go through your chemistry book and draw graphs associated to a few common molecules.
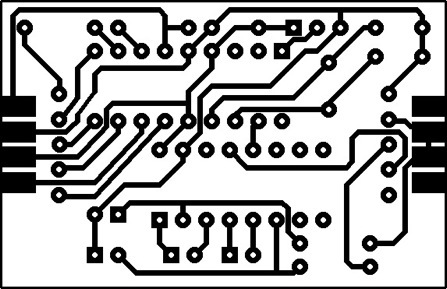
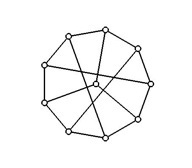
Example 3: Circuit Board Diagrams
These can be viewed as graphs as well, with the wires between points on the circuit board acting as the edges between the nodes of the board (our vertices.) None of the wires can touch, which makes this a very special type of graph. We’ll talk more about these graphs (called planar graphs) in a later session.
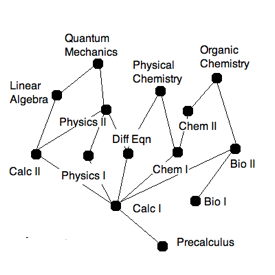
Example 4: Class Requirements
We can represent class requirements as a graph as well - connect two courses if one requires the other on the prerequisites list. Looking at the graph, we can arrange it so that courses that are required first are lower in the representation.
Exercise: Make a similar graph from the class requirements for your own school.
Graphs of these types are even more specialized - they are called “partially ordered sets,” and we have several other ways that we’ll encounter them. We’ll come back to these in the page on “Graphs and Polynomials.”
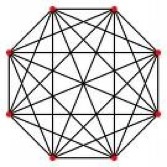
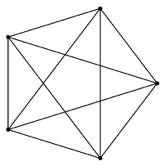
Exercise: Let’s say we have n people in a room and would like them to all shake hands. How many ways are there of doing this? Represent this in some way as a graph.
Answer/Definition: Graphs of this form are called “complete graphs.” They have every vertex in the graph connected to every other vertex exactly once, and we will denote them as  .
.
We will discuss multiple other places that graphs appear in subsequent lessons, but already it should be apparent that graphs show up naturally and usefully in many different fields.