Antisymmetric Orthogonal Polynomials: Graphs
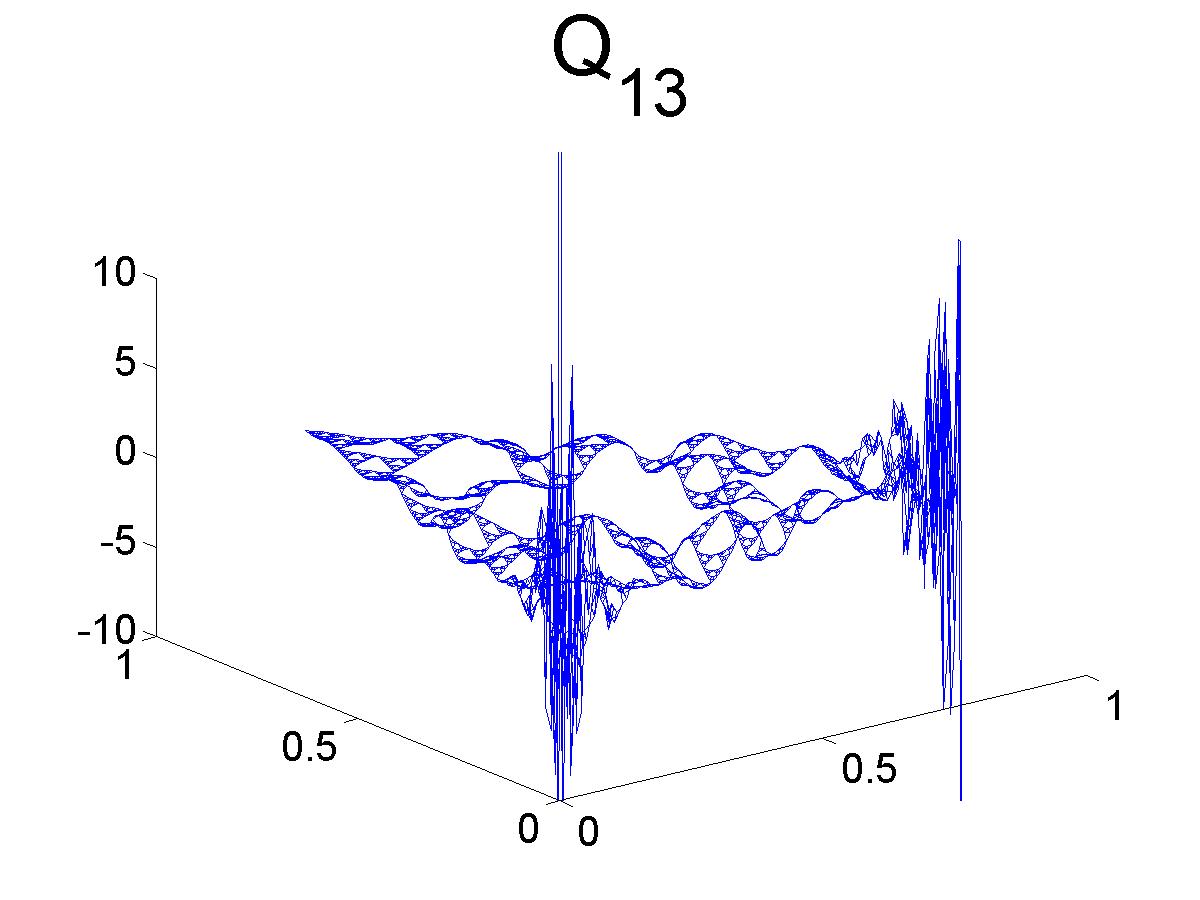
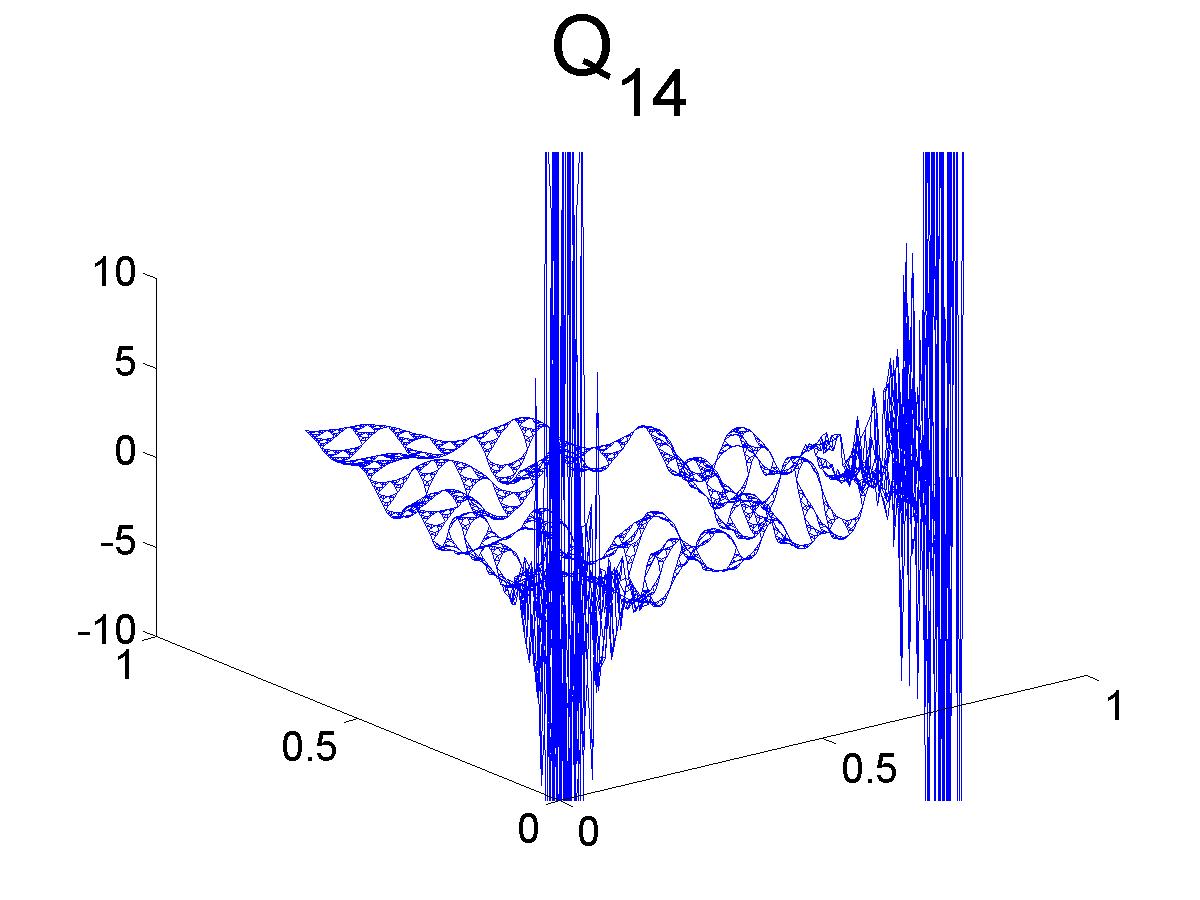
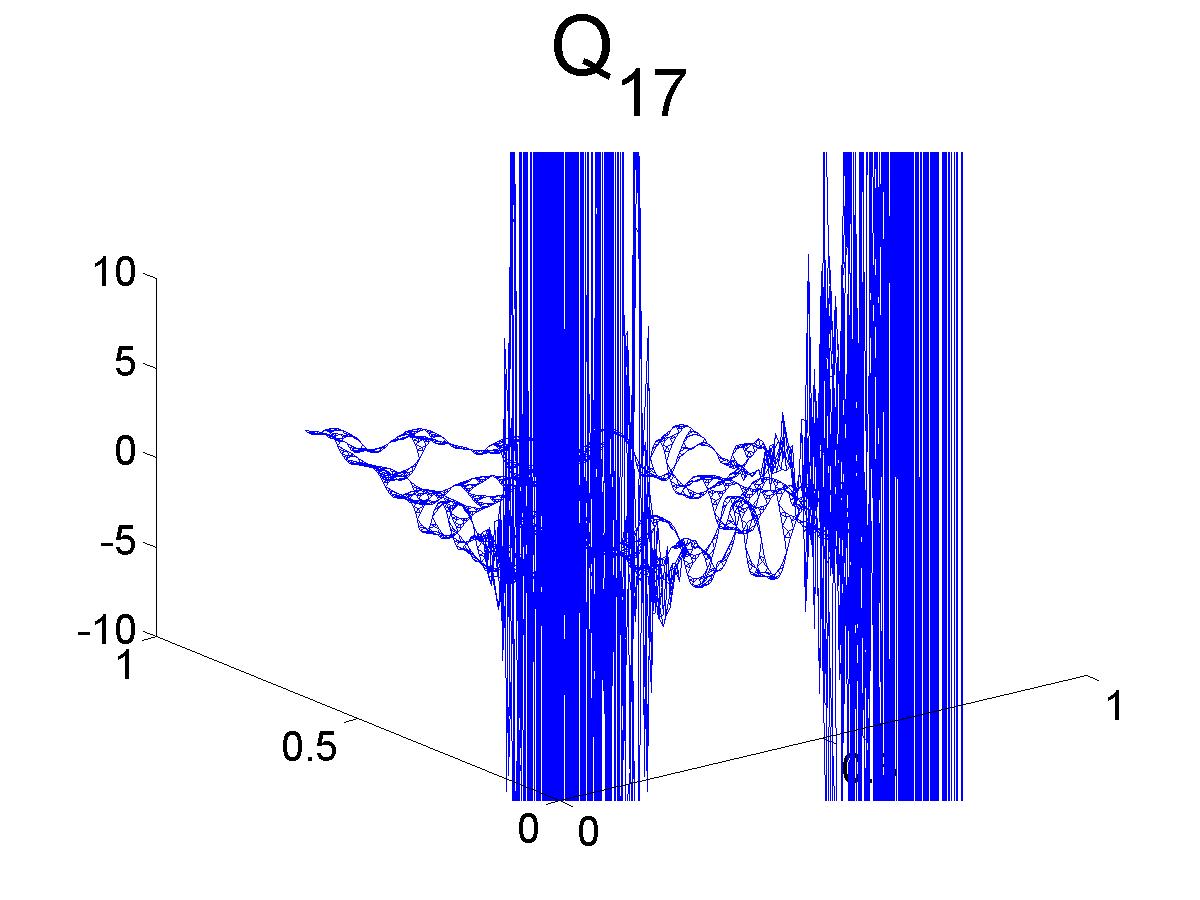
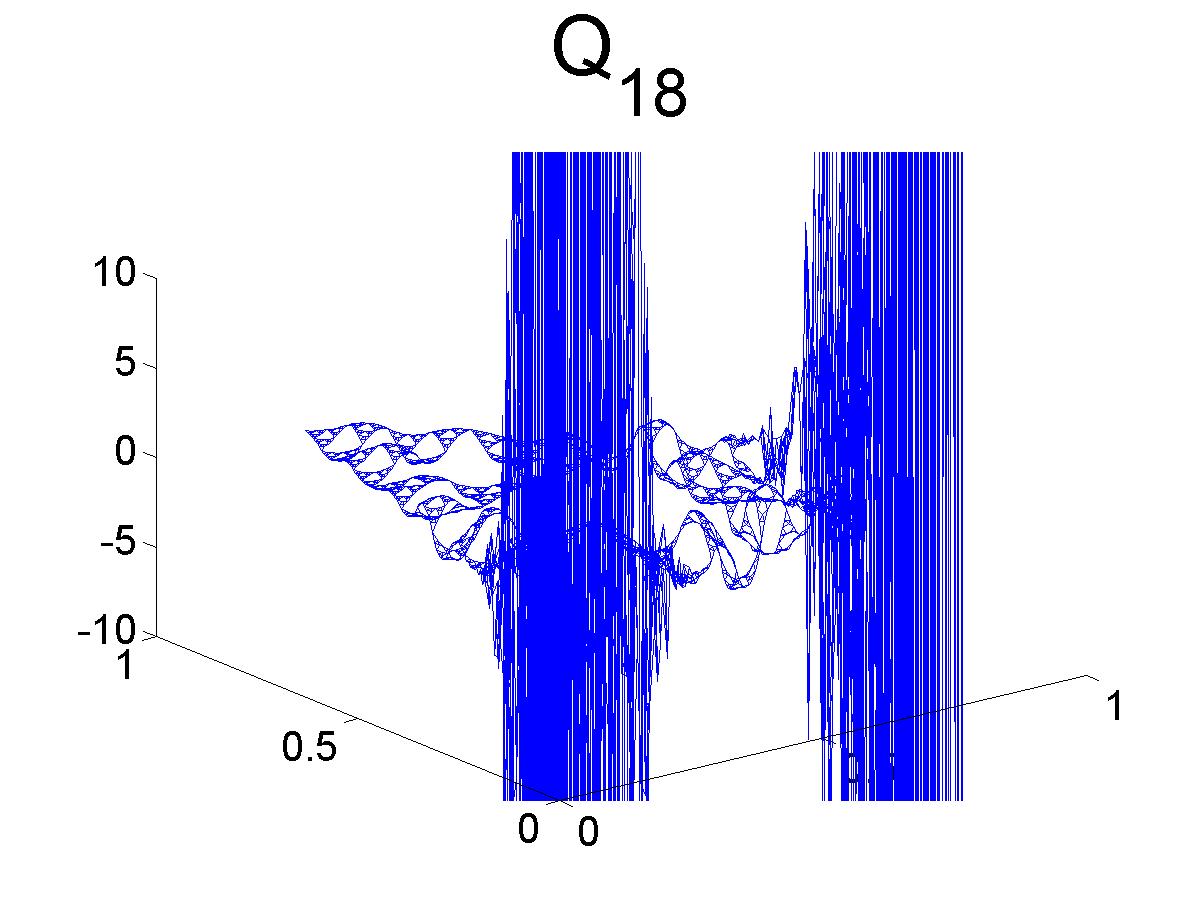
Here we plot the graphs of the first 20 Antisymmetric Orthogonal Polynomials. These arise from orthonormalizing the Pj3 monomials. See Recurrence Relation Page for a description of the calculation of these OP.
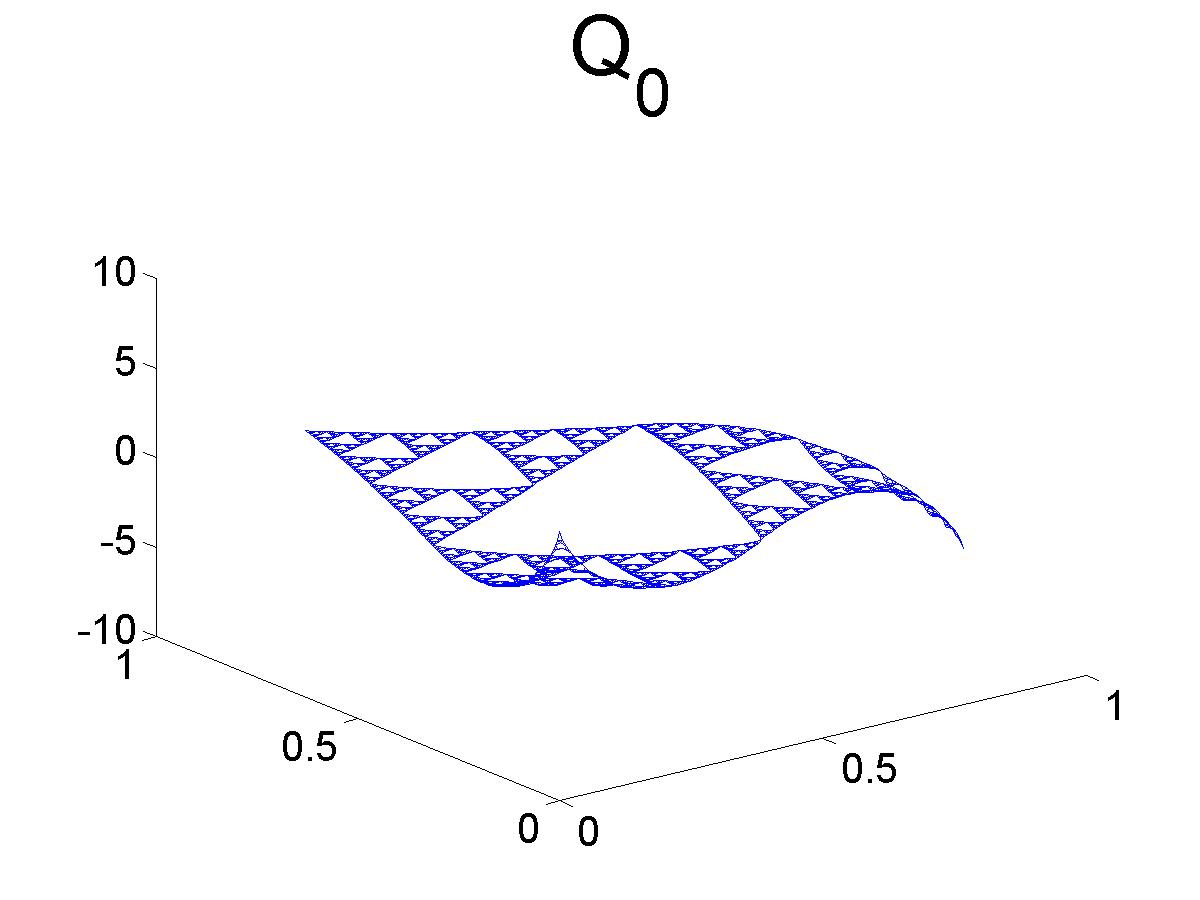
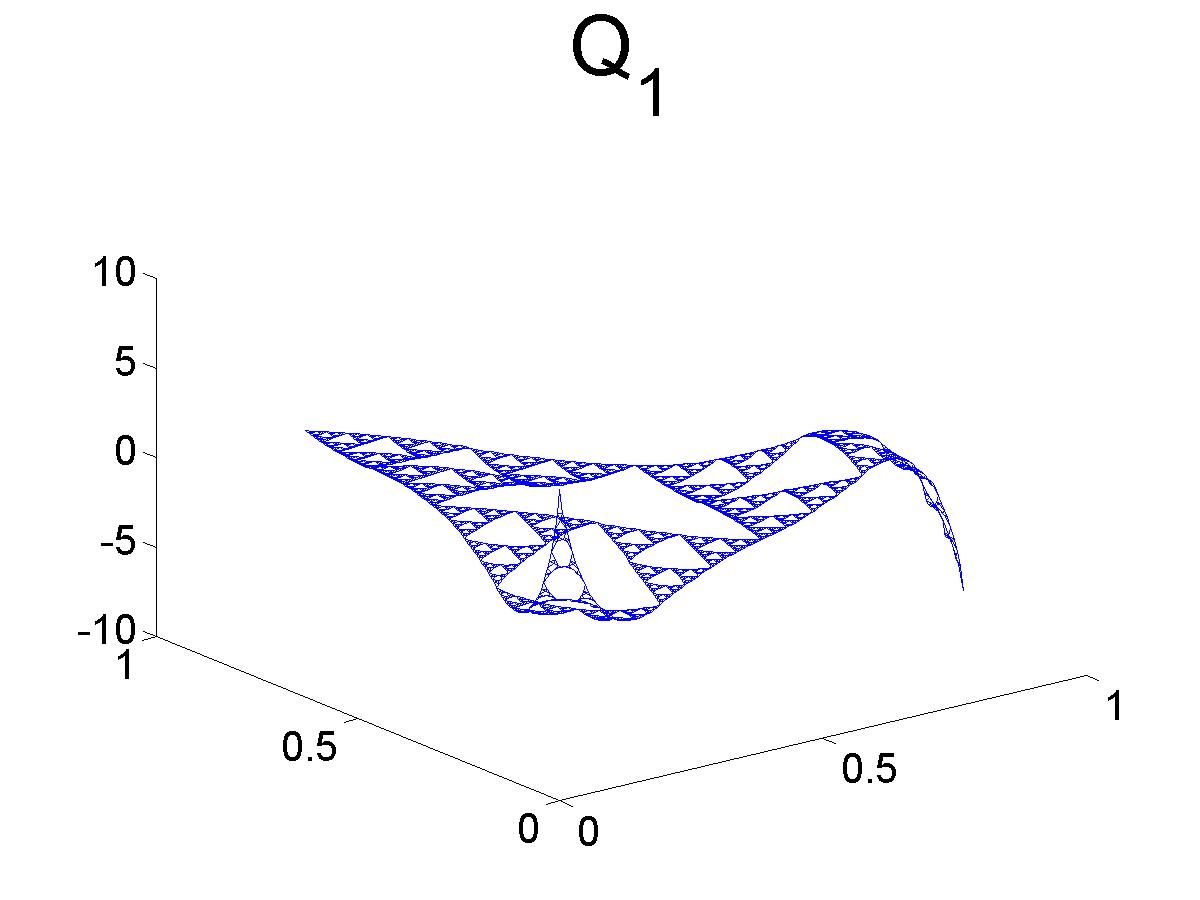
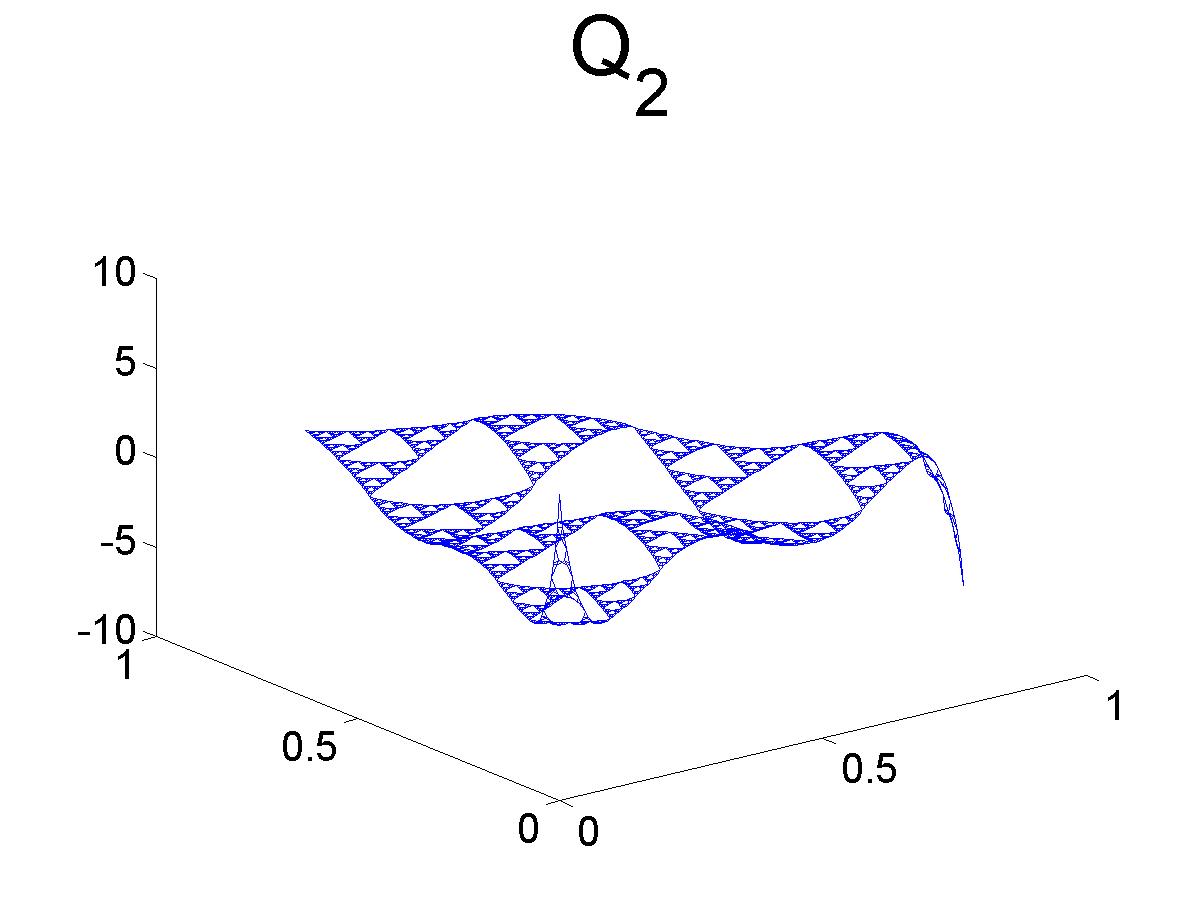


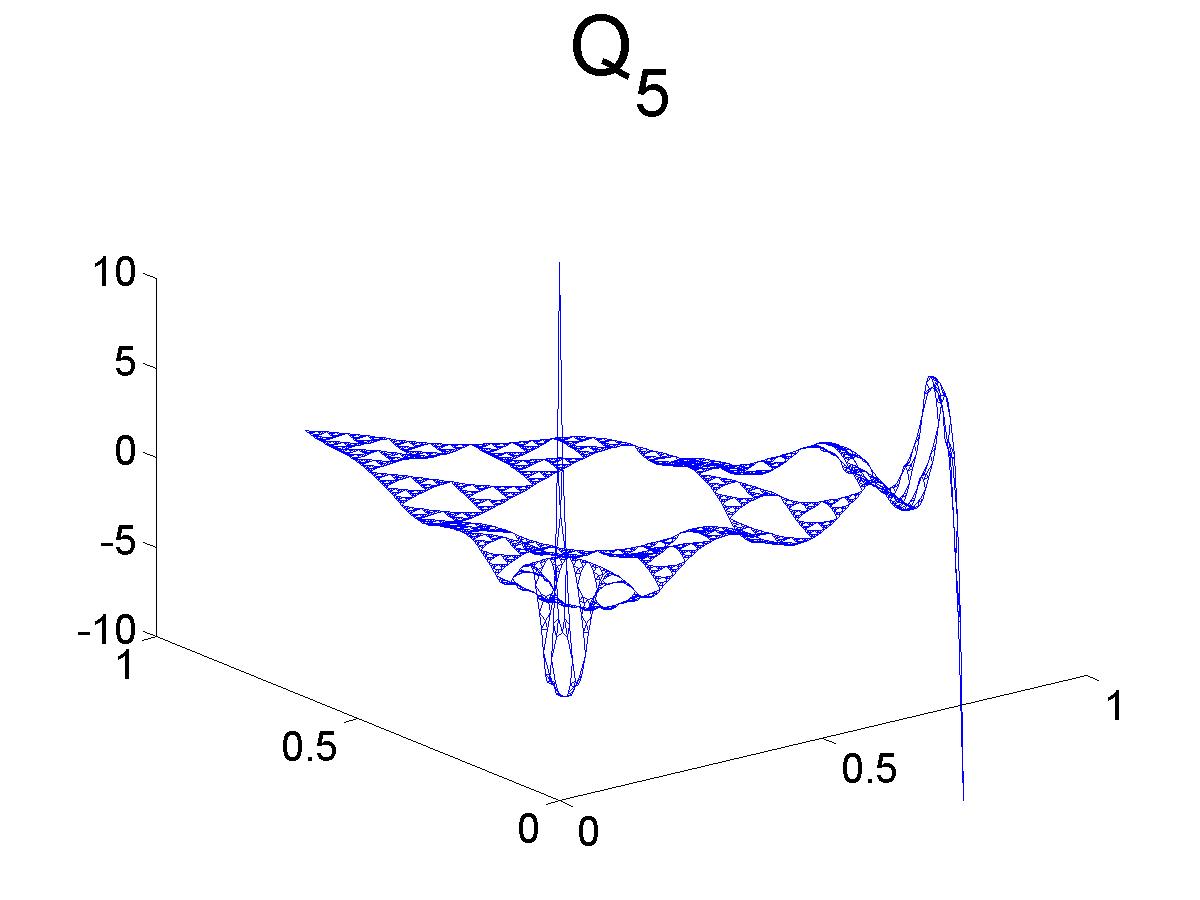
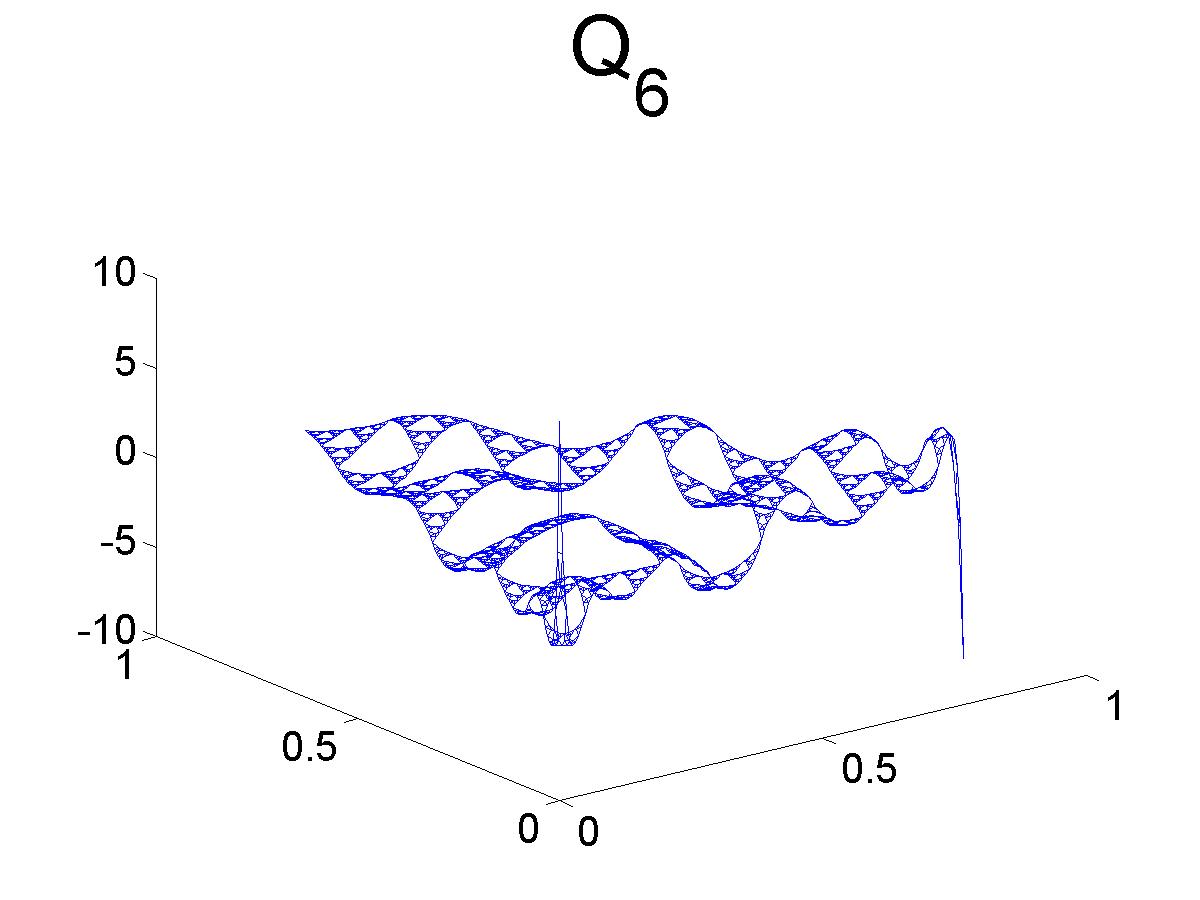

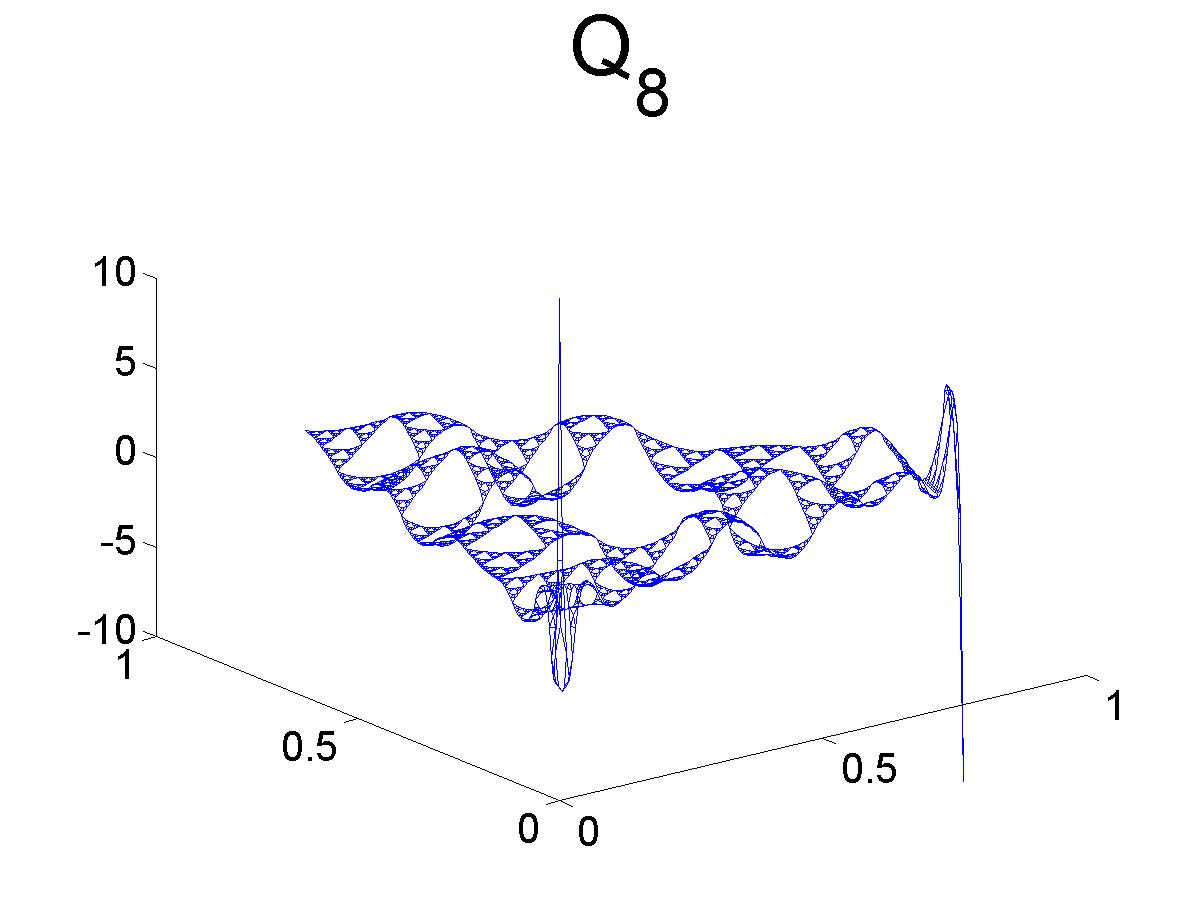
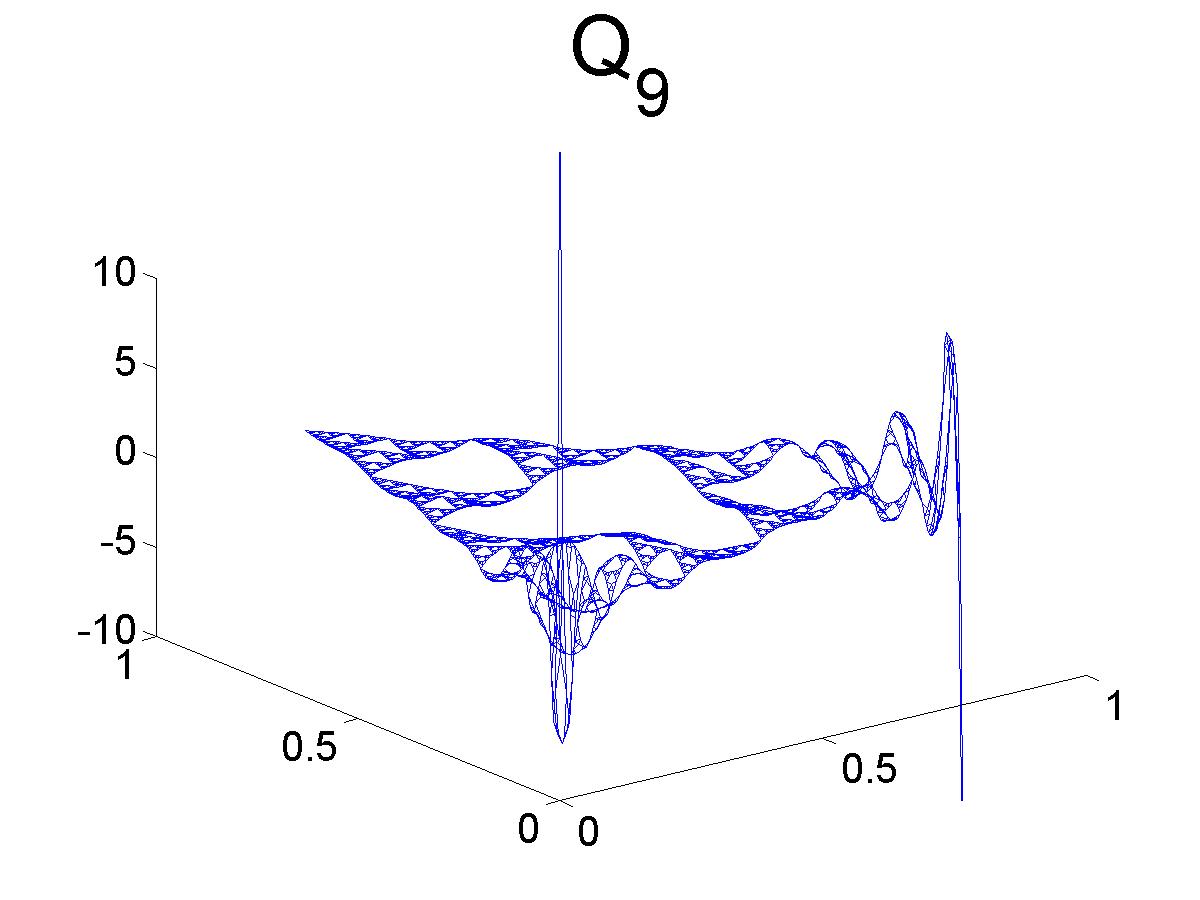
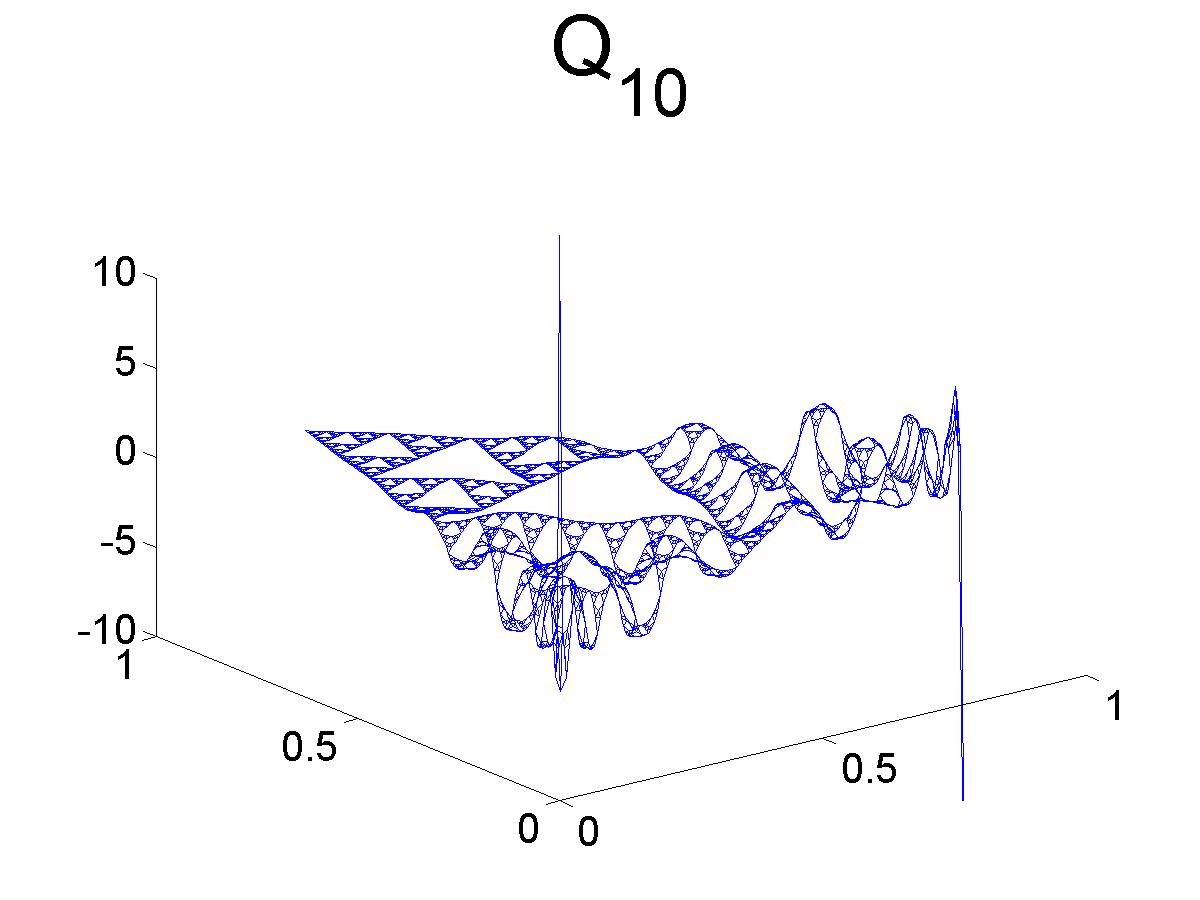
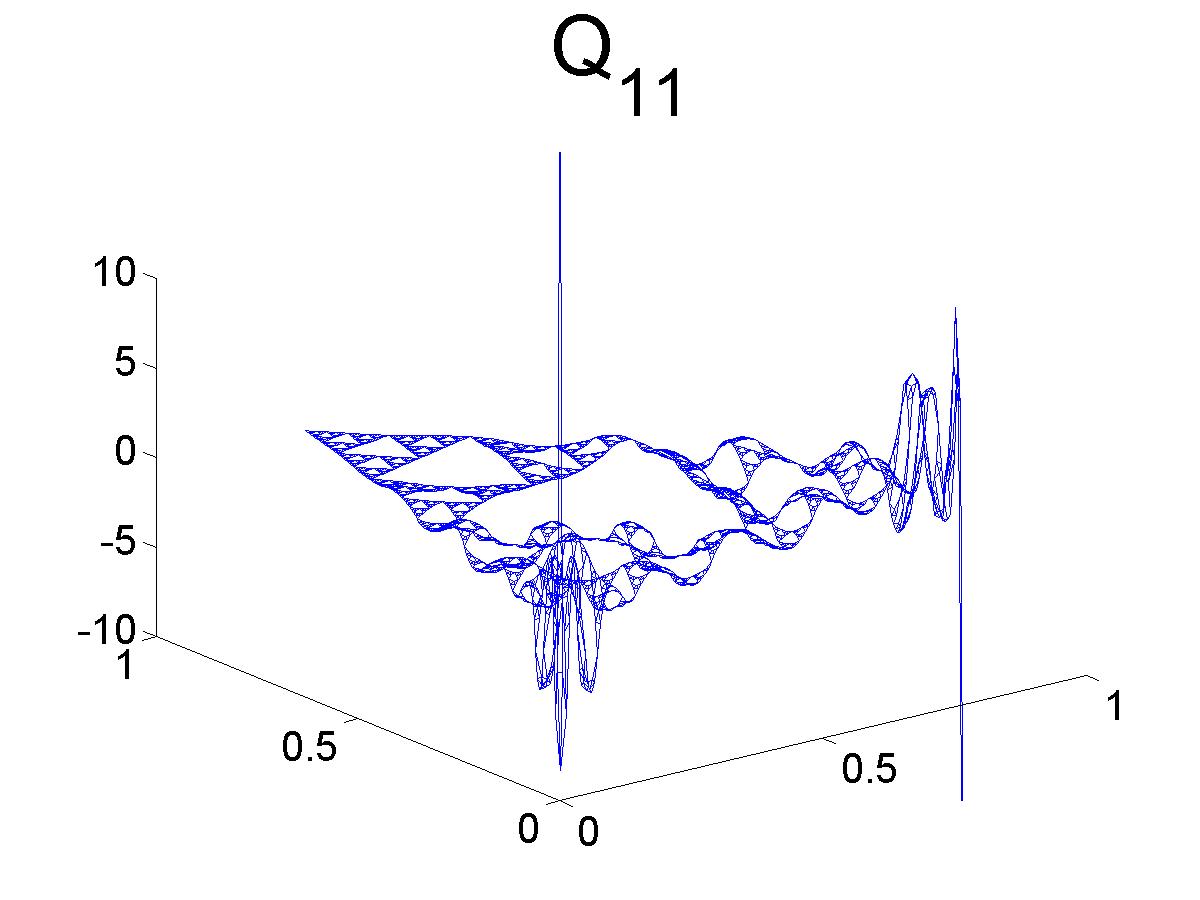

The graphs below show a strange behavior near the endpoints. This might be due to the resolution size of the Sierpinski Gasket. (does a similar thing happen on the unit interval?)