We compare the mRNA sequences for proteins Rattus norvegicus cytochrome P450 IIA1 and IIA2, (Cyp2a1 and Cyp2a2), from [MNKG], and Mus musculus cytochrome P450, IIA12 (Cyp2a12), from [ILJN].
|
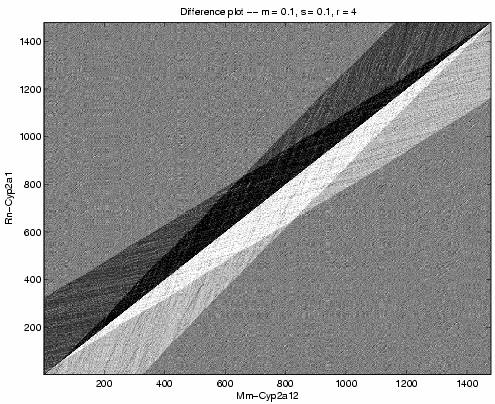
Figure 1 shows a grayscale plot ![]() for
sequences Rn-Cyp2a1 and Mm-Cyp2a12 using the parameters m =
s = 0.1 and r = 4.
From this picture, we can infer that the evolutionary history between these
sequences contains no jump events. Thus, we set
for
sequences Rn-Cyp2a1 and Mm-Cyp2a12 using the parameters m =
s = 0.1 and r = 4.
From this picture, we can infer that the evolutionary history between these
sequences contains no jump events. Thus, we set ![]() for further
iterations. We also see no deletion events, so we decrease
for further
iterations. We also see no deletion events, so we decrease ![]()
|
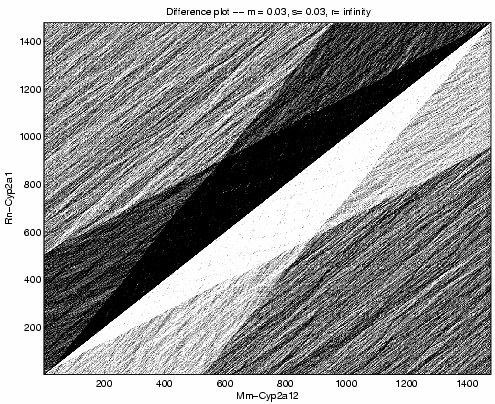
Figure 2 shows a grayscale plot of ![]() with
parameters
with
parameters ![]() ,
, ![]() . We perform this computation
for all three pairs of sequences. For the following pairs, we
calculated the difference between the maximum and minimum of the
. We perform this computation
for all three pairs of sequences. For the following pairs, we
calculated the difference between the maximum and minimum of the ![]() array.
array.
| Mm-Cyp2a12 | Rn-Cyp2a1 | 2263 |
| Mm-Cyp2a12 | Rn-Cyp2a2 | 2110 |
| Rn-Cyp2a1 | Rn-Cyp2a2 | 2398 |
| Mm-Cyp2a12 | Mm-Cyp2a12 | 2844 |
We expect two random sequences to be about 27% identical.
The value is greater than 25%, because the distribution of nucleotides
![]() is not flat. We know Mm-Cyp2a12 is 100% identical to
itself. By dividing 73% into 2844, we find that
a difference of 38 units of log-likelihood represents
1% of sequence identity for these sequences and parameters.
is not flat. We know Mm-Cyp2a12 is 100% identical to
itself. By dividing 73% into 2844, we find that
a difference of 38 units of log-likelihood represents
1% of sequence identity for these sequences and parameters.
We estimate the following sequence divergences:
| Mm-Cyp2a12 | Rn-Cyp2a1 | 14.9% |
| Mm-Cyp2a12 | Rn-Cyp2a2 | 18.8% |
| Rn-Cyp2a1 | Rn-Cyp2a2 | 11.4% |
![\begin{figure}\centering %% [htbp]
\begin{picture}(200, 200)(0,0)
\put(100,100){...
...ne(-3,-2){75}}
\put(145,75){7}
\put(135,37){Rn-Cyp2a2}
\end{picture}\end{figure}](img131.png) |
We compute arrays with new parameters. We maintain ![]() .
We set
.
We set ![]() . We set
. We set ![]() to be the whole number percentages
near the values computed above. The plots of
to be the whole number percentages
near the values computed above. The plots of ![]() are similar
to those for figures 1 and 2.
The values of
are similar
to those for figures 1 and 2.
The values of ![]() which produce the maximum log-likelihoods are:
which produce the maximum log-likelihoods are:
| Mm-Cyp2a12 | Rn-Cyp2a1 | 14% |
| Mm-Cyp2a12 | Rn-Cyp2a2 | 17% |
| Rn-Cyp2a1 | Rn-Cyp2a2 | 11% |
Figure 3 represents these percent identities as branch lengths on an unrooted phylogenetic tree.