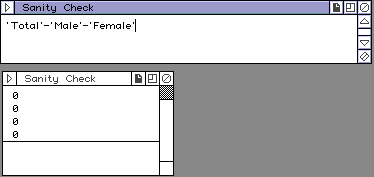
The physicians data set was small and simply proof reading the data values individually would be one way of checking the data entry. In a much larger data set, such proof reading can be tedious and error prone itself. Even on this small data set, we have another easy check. The data values entered include a total. We can check for internal consistency of the data by confirming that the sum of Male and Female equals the Total:
In DataDesk, open the Physicians Data and create a new derived variable. Name it Sanity Check. Drag the icons for Total, Male and Female to the window. This will give you a list of the names of the icons. Edit the list to make the equation 'Total'-'Male'-'Female' and switch to "Show Numbers". If you do not have a table of zeros, an error must have been made in the data entry. By selecting any non-zero value, DataDesk will highlight the values in the original tables and you can focus your attention on correcting the erroneous value.
In other contexts, you may have some other summary values for the data which were computed at the time the data were collected, such as mean, standard deviation, other totals or subtotals. It is valuable to compute any such values you may have to help assure your further investigations are not a waste of time due to flawed data entry.
The temperature anomalies data from NOAA present a different challenge. If you recall, the temperature anomalies represent departures from an average temperature. They are reported to two decimal places and so, overall, they should average 0 to a couple of decimal places. Select all the icons for the variables from the NOAA data set and calculate summaries as variables. Then examine the summaries. If you selected all the variables, the first in the report will be Year which of course, does not average zero, but rather 1940, the average of the years in the 121 year time span. What about the rest of the values? Are they all close to zero?
From the summaries, open the icons for levels, mean and sdev and create a scatter plot of mean and sdev. Use the lasso tool to circle various points on the plot and note which of the underlying values are involved. The Year value is already accounted for. What about December?
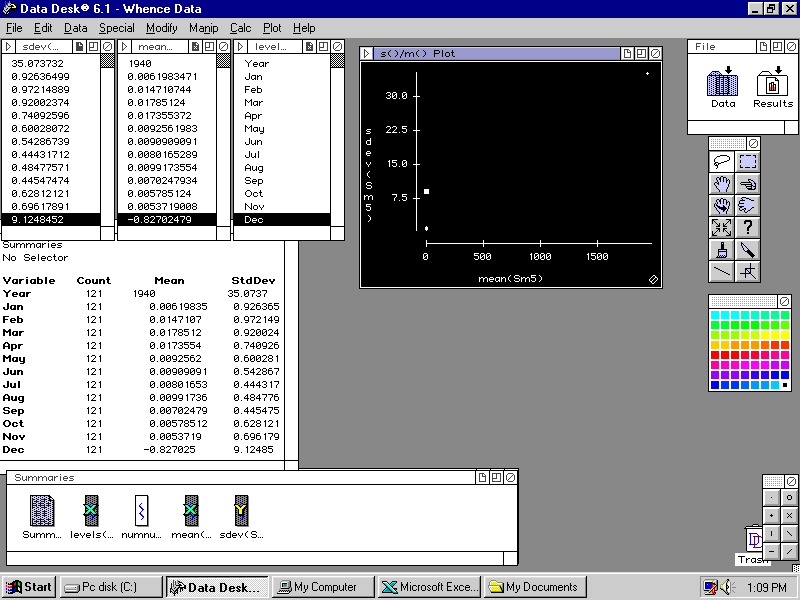
Open the December data icon and look at the individual values.
What you see there is a common data coding technique. A value of -99.9 is apparently being used to signify that the data value is missing. -99.9 is certainly not a reasonable value for the December 2000 temperature anomaly and perhaps at the time of posting to the web, the data for the last month of 2000 were not yet available.
If we want to investigate these data further, we must note that the data value was missing and use some more reasonable value. What might be a reasonable value to use?