
Compare Antisymmetric and Symmetric OP: Dynamics
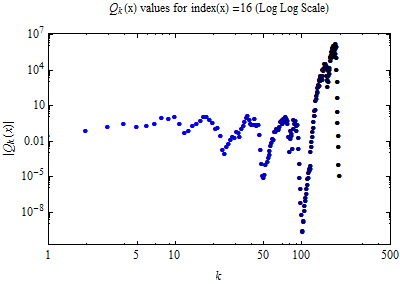
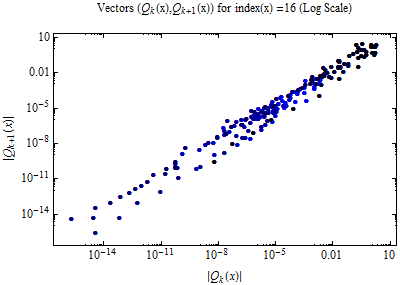
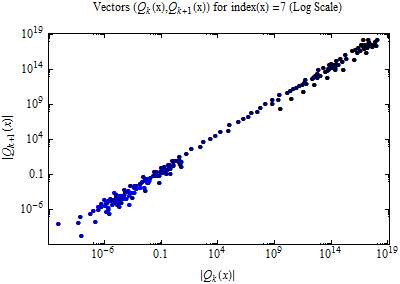
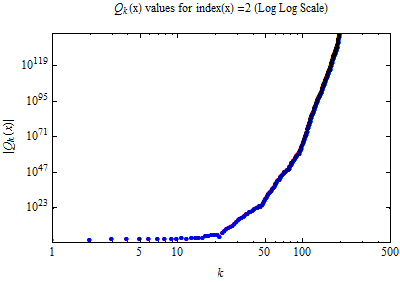
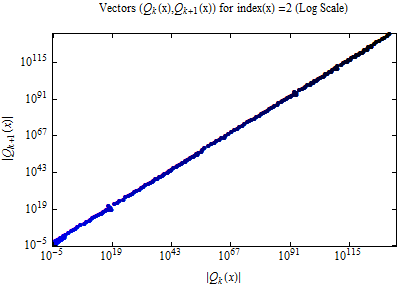
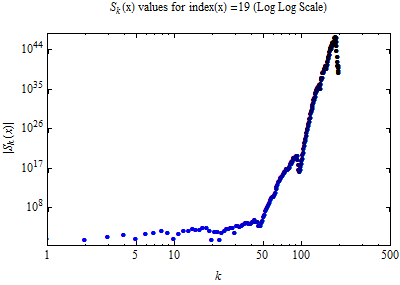
We want to compare dynamics of both the Antisymemtric and Symmetric OP. Here, we decided to compare points at which the dynamics for both OP disply similar behavior. Plots occur in groups off four. The Antisymmetric OP are shown on the left, and the Symmetric OP are on the right. The first line of plots are log|Qk(x)| versus log(k) and log|Sk(x)| versus log(k). The second line of plots are log|Qk+1(x)| versus log|Qk(x)| and log|Sk+1(x)| versus log|Sk(x)|.Also, note that we take the absolute value of the values of the OP, which removes some of the structure of the dynamics.
Underneath the dynamics plots we explain the addressing system of the points.


Addressing System
 For each point x in SG, we assign an index.
For the dynamics, we only use points up to level m=3 in SG. The first three indices are the boundary points labeled
in counterclockwise order. The next three indices are the contraction mappings of SG of oder m=1, in numerical order
α =0,1,2. The points which have not yet been labeled are then given indices, again in counterclockwise order. This pattern is continued for each
contraction mapping, in increasing order of m. The indices are displayed in the image to the right; click the image to enlarge.
For each point x in SG, we assign an index.
For the dynamics, we only use points up to level m=3 in SG. The first three indices are the boundary points labeled
in counterclockwise order. The next three indices are the contraction mappings of SG of oder m=1, in numerical order
α =0,1,2. The points which have not yet been labeled are then given indices, again in counterclockwise order. This pattern is continued for each
contraction mapping, in increasing order of m. The indices are displayed in the image to the right; click the image to enlarge.