Compare Antisymmetric and Symmetric OP: Zero Plots
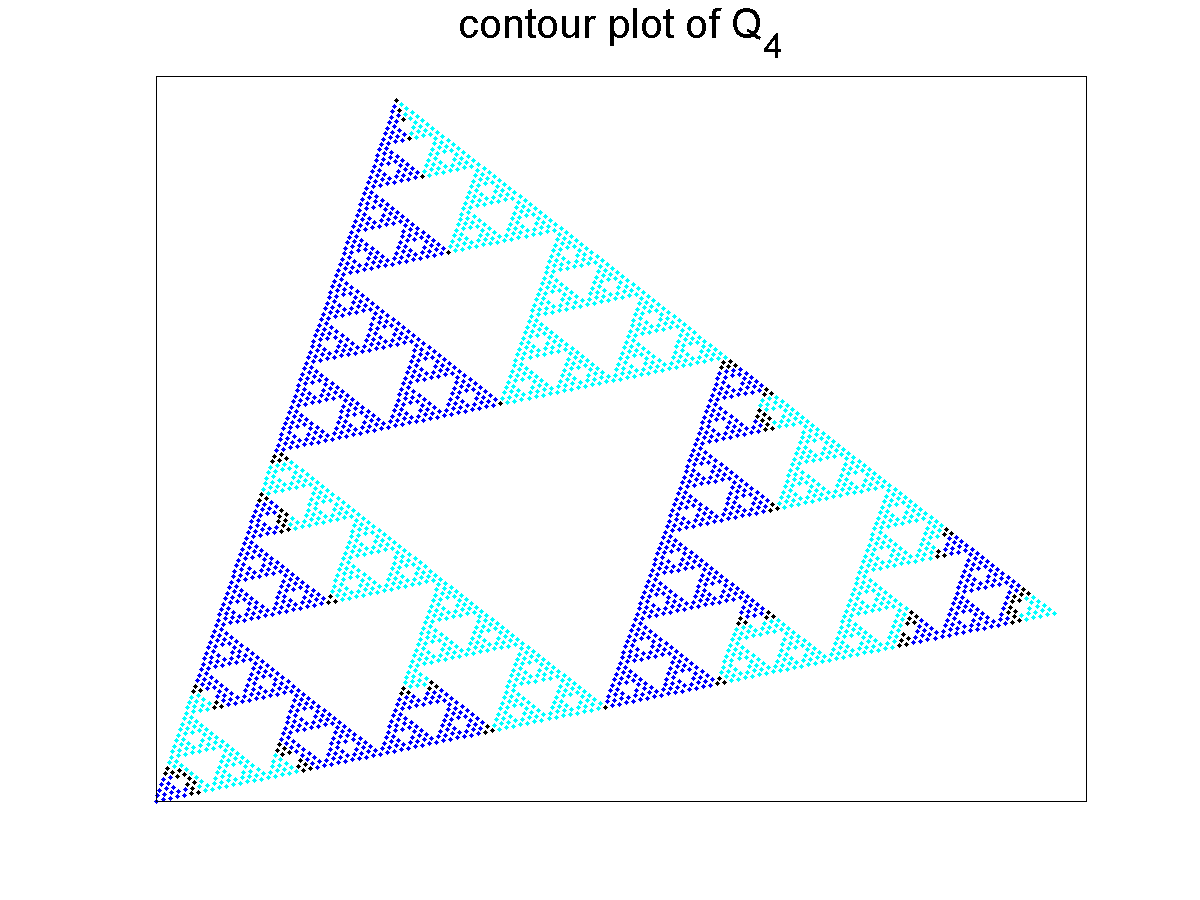
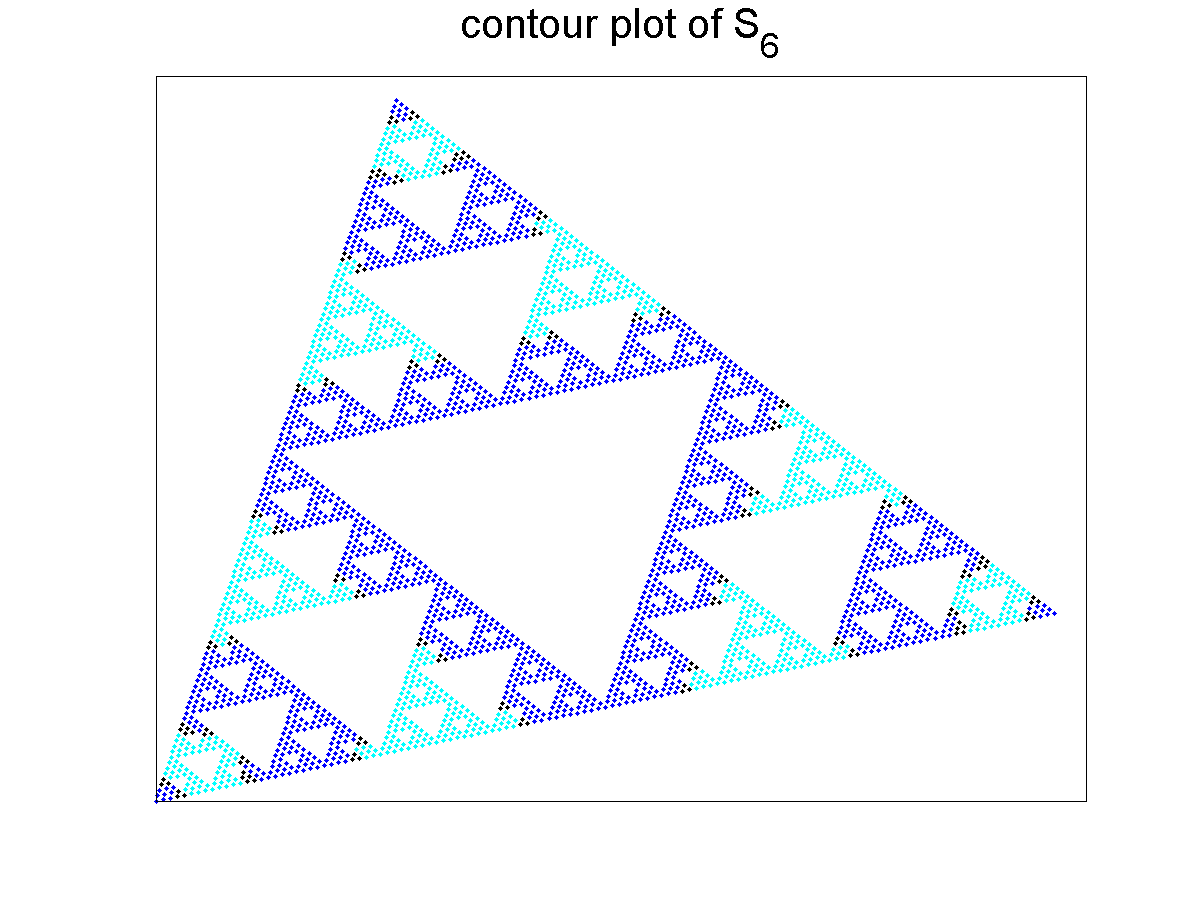
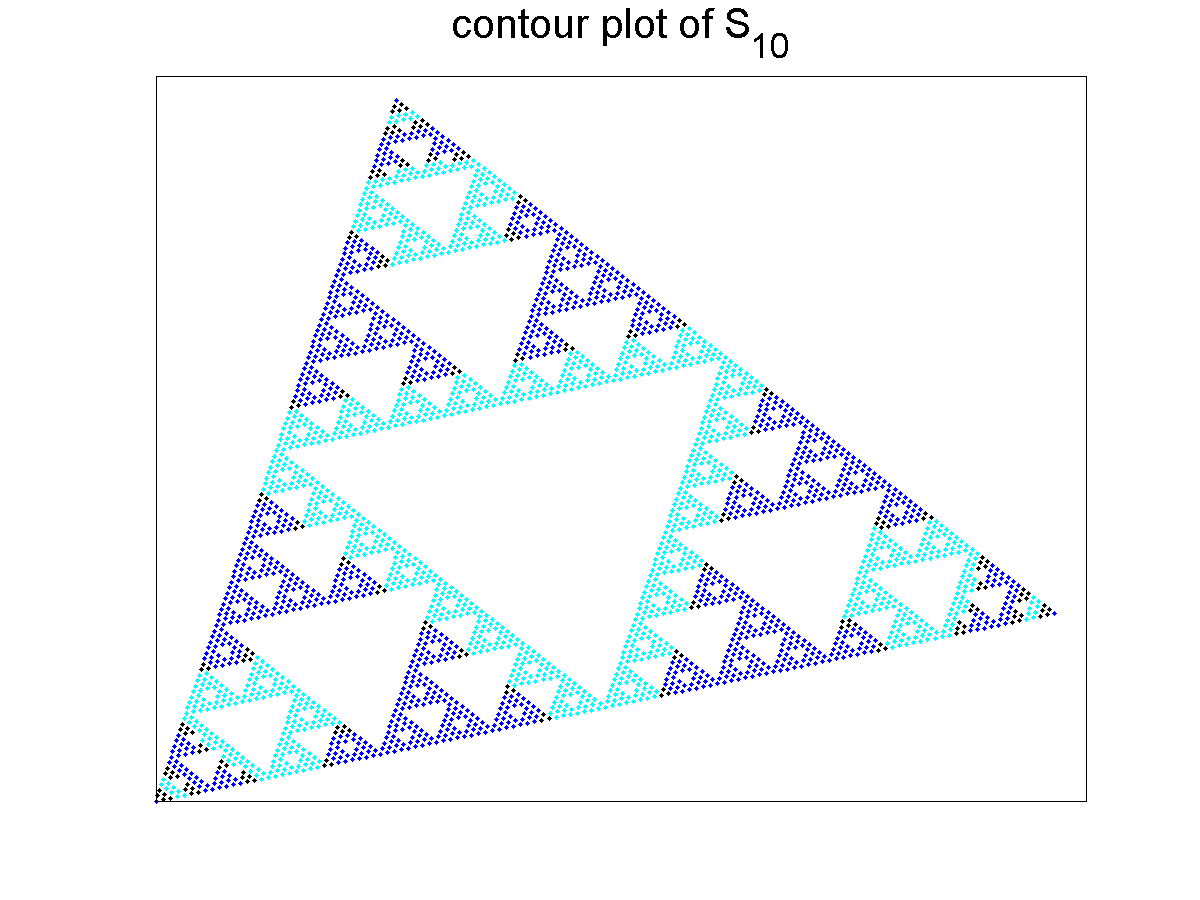
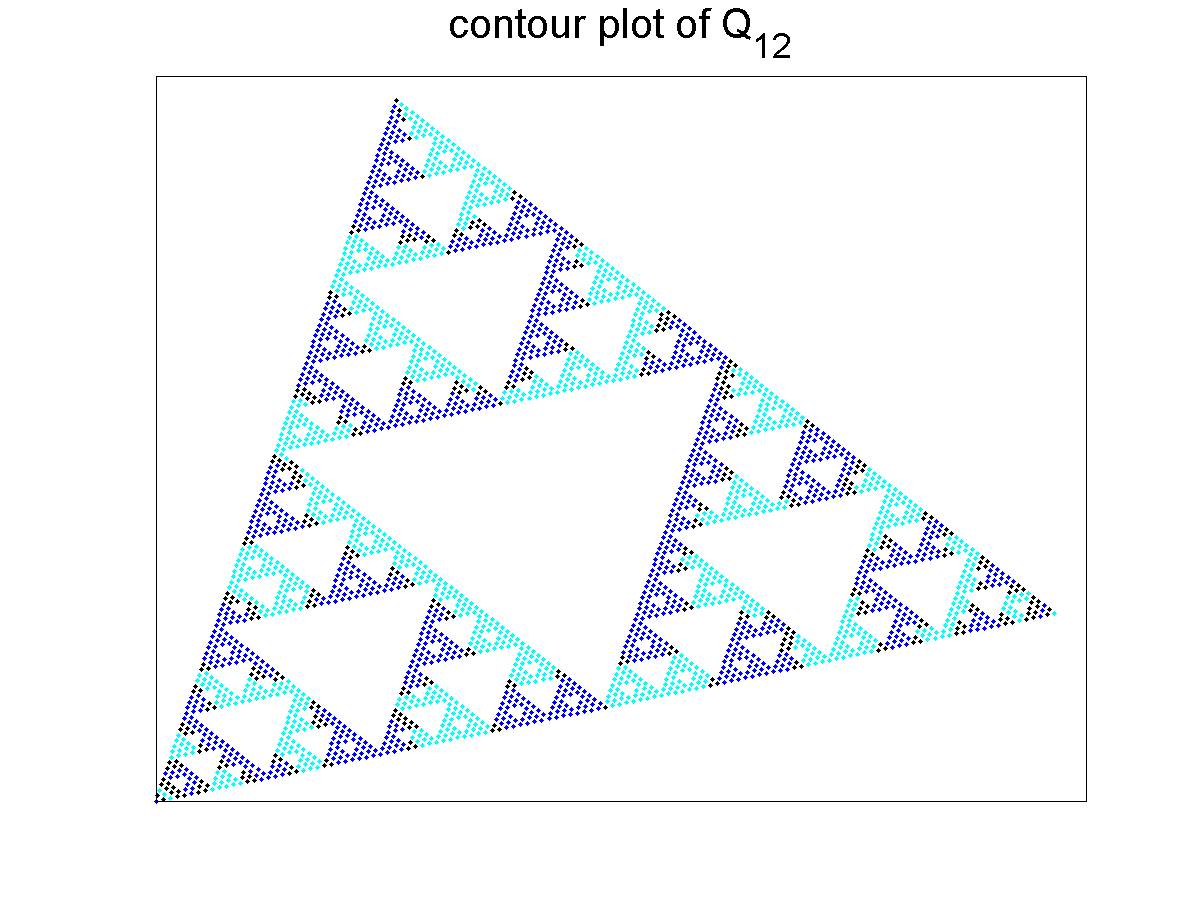
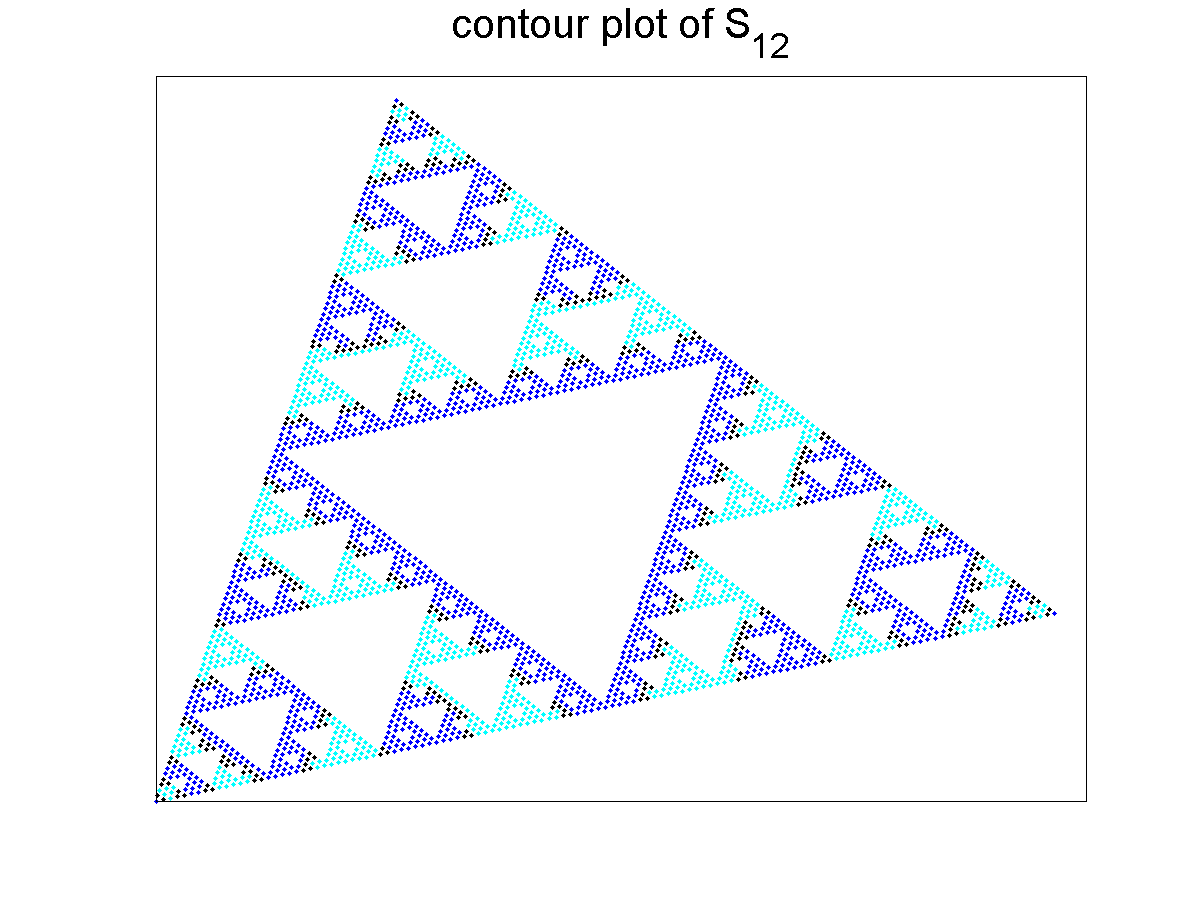
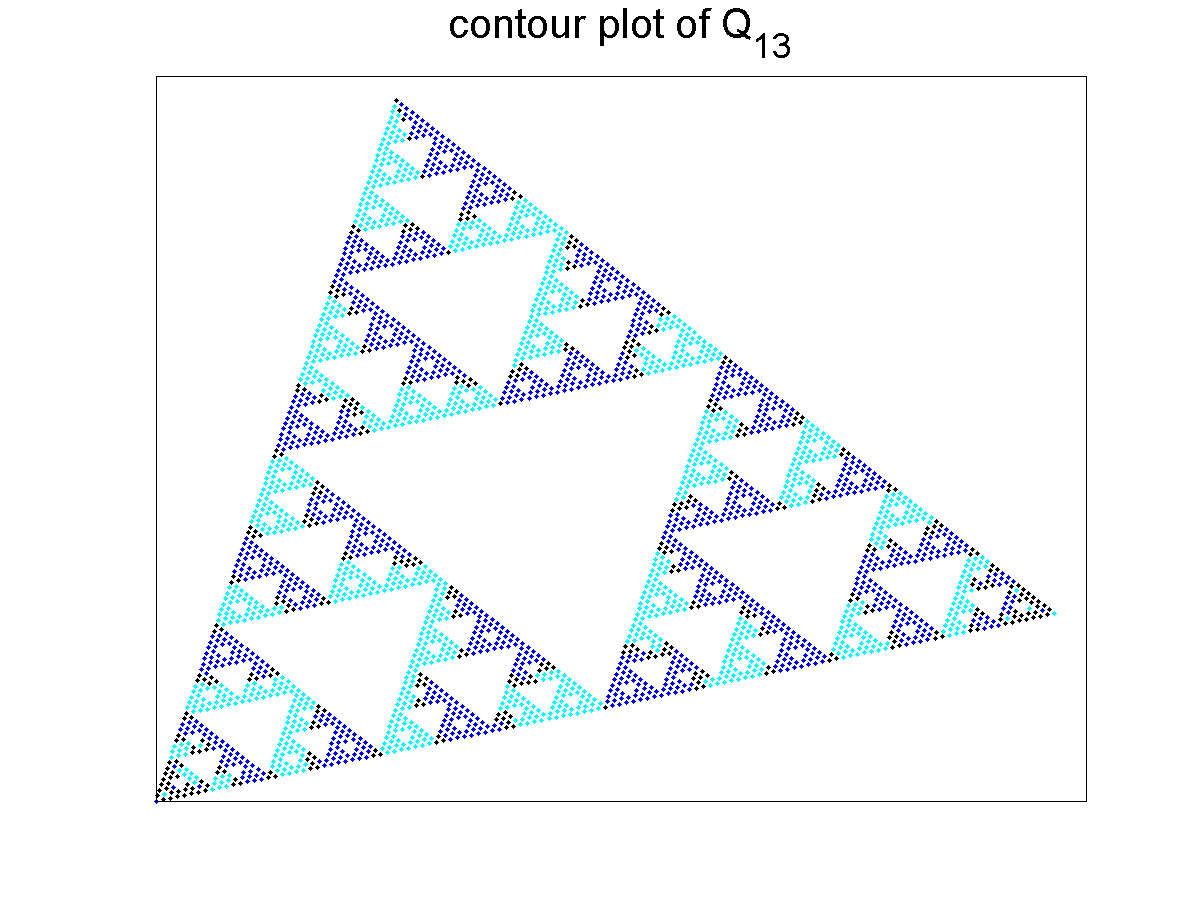
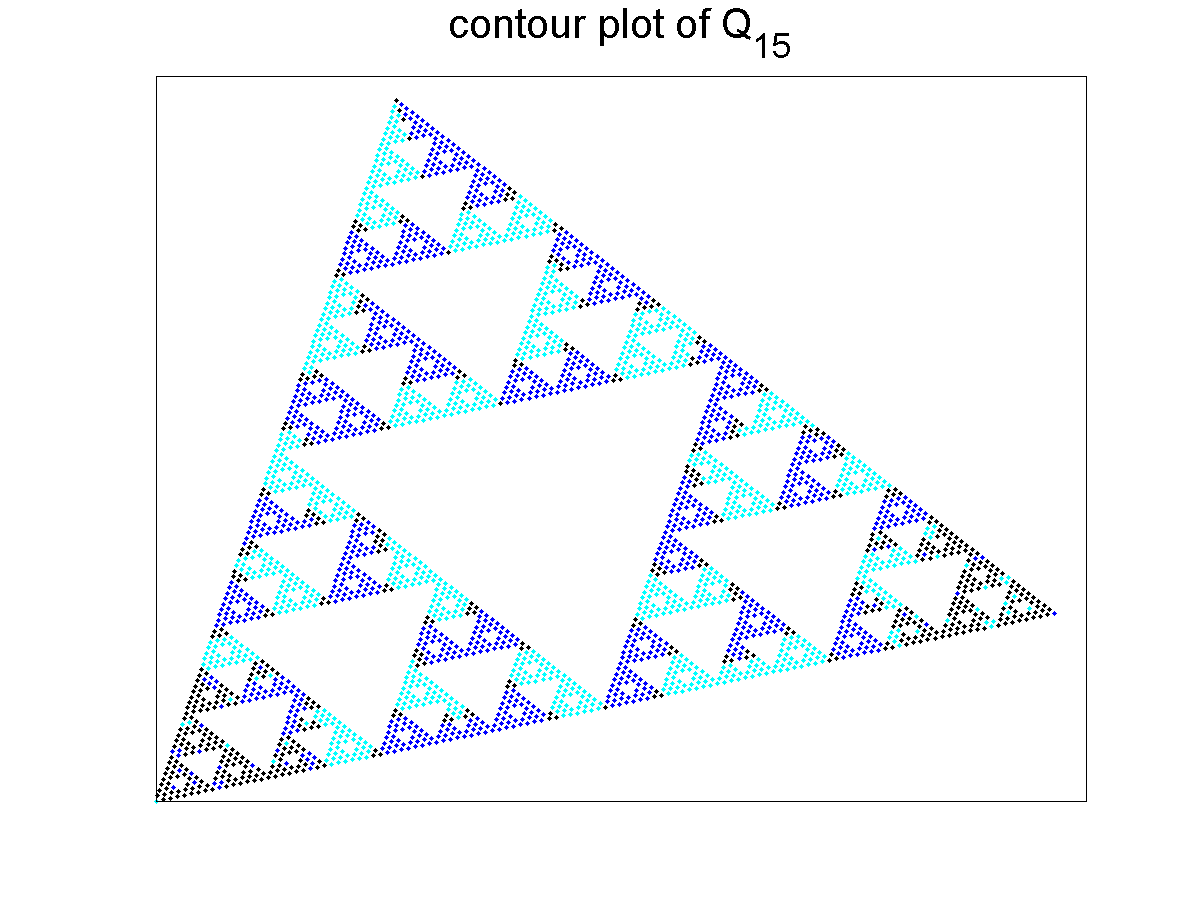
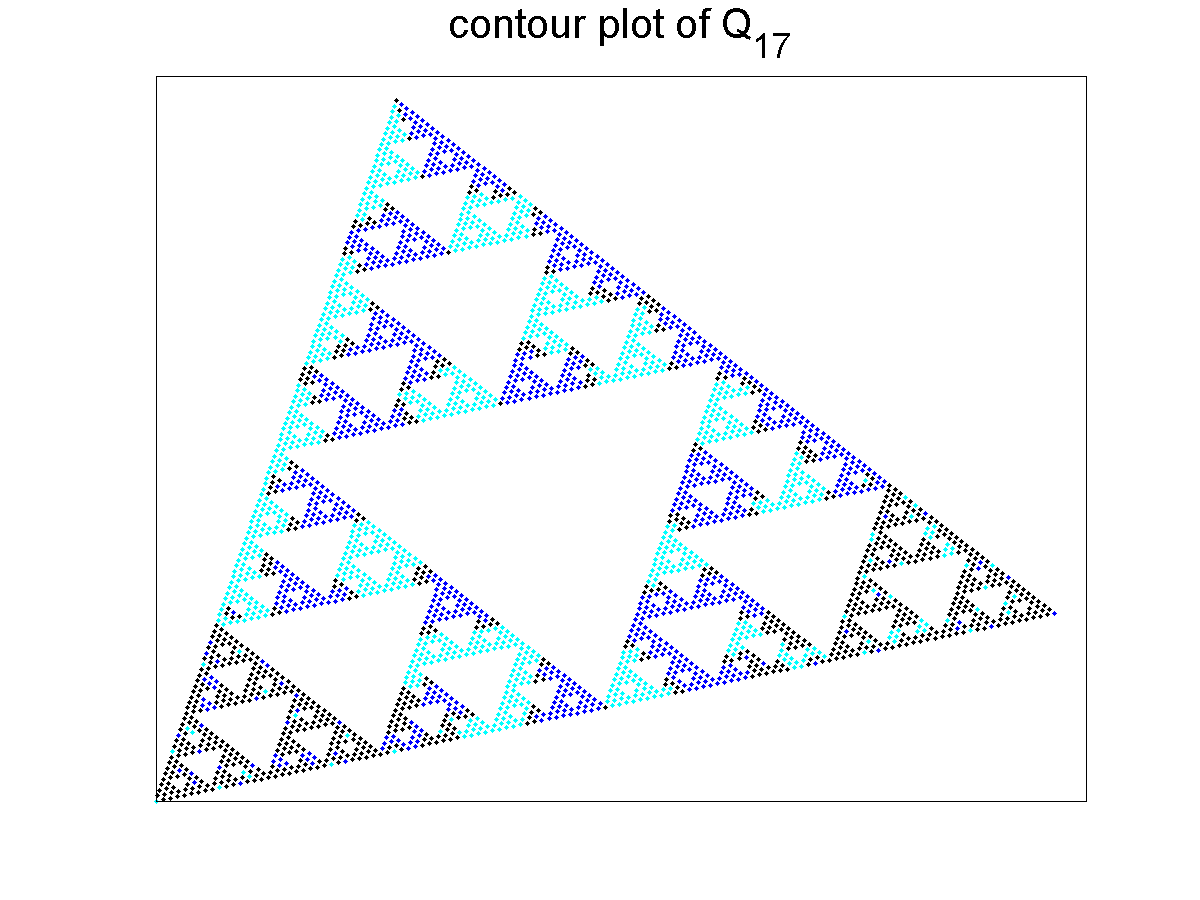
Here we have plotted the zero sets for the Antisymmetric OP on the left, and the Symmetric OP on the right. You can click on each picture to enlarge it.
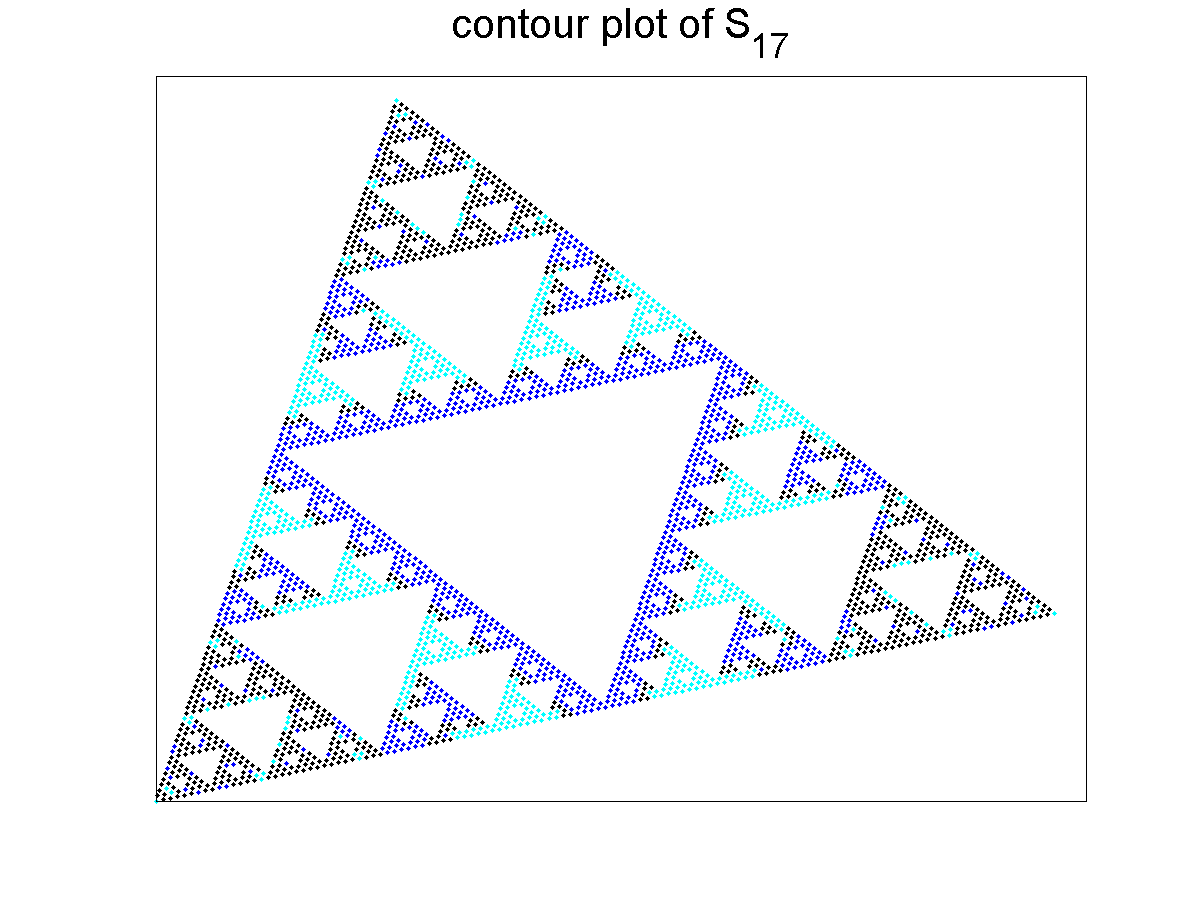
In the following plots, the postive values of the OP are plotted in blue, while the negative values are plotted in cyan. Potential zeros are plotted in black. A point is labeled a potential zero if two of its neighbors have opposite signs. Note that these graphs only plot points up to level m=7.